
 Yahoo Finance
 Is Thomas Cook Group plc’s (LON:TCG) Balance Sheet A Threat To Its Future?

Small and large cap stocks are widely popular for a variety of reasons, however, mid-cap companies such as Thomas Cook Group plc (LON:TCG), with a market cap of UK£1.71b, often get neglected by retail investors. However, generally ignored mid-caps have historically delivered better risk adjusted returns than both of those groups. Let’s take a look at TCG’s debt concentration and assess their financial liquidity to get an idea of their ability to fund strategic acquisitions and grow through cyclical pressures. Remember this is a very top-level look that focuses exclusively on financial health, so I recommend a deeper analysis into TCG here. See our latest analysis for Thomas Cook Group
Does TCG produce enough cash relative to debt?
Over the past year, TCG has reduced its debt from UK£1.92b to UK£1.45b , which comprises of short- and long-term debt. With this debt payback, TCG currently has UK£1.81b remaining in cash and short-term investments for investing into the business. On top of this, TCG has produced cash from operations of UK£496.00m during the same period of time, leading to an operating cash to total debt ratio of 34.30%, signalling that TCG’s operating cash is sufficient to cover its debt. This ratio can also be interpreted as a measure of efficiency as an alternative to return on assets. In TCG’s case, it is able to generate 0.34x cash from its debt capital.
Does TCG’s liquid assets cover its short-term commitments?
Looking at TCG’s most recent UK£4.33b liabilities, the company is not able to meet these obligations given the level of current assets of UK£2.34b, with a current ratio of 0.54x below the prudent level of 3x.
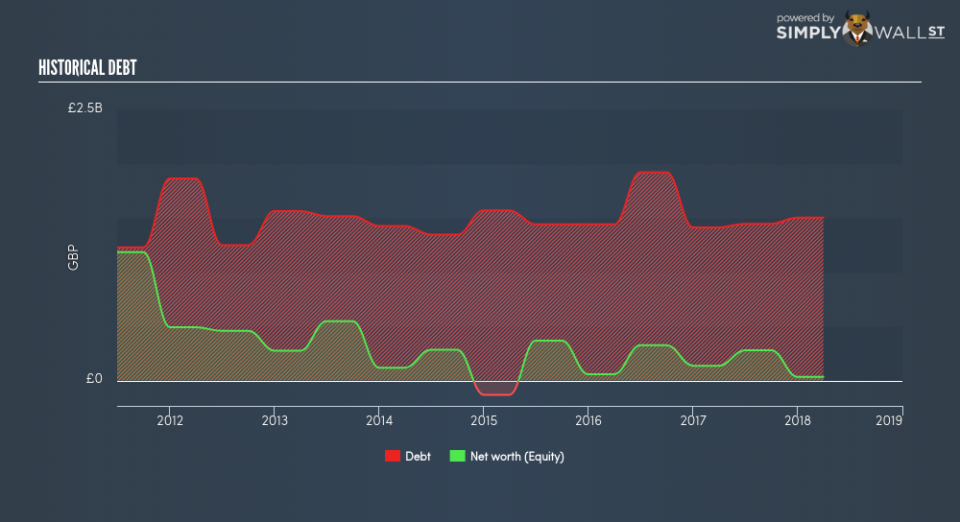
Can TCG service its debt comfortably?
With total debt exceeding equities, TCG is considered a highly levered company. This is not uncommon for a mid-cap company given that debt tends to be lower-cost and at times, more accessible. No matter how high the company’s debt, if it can easily cover the interest payments, it’s considered to be efficient with its use of excess leverage. A company generating earnings after interest and tax at least three times its net interest payments is considered financially sound. In TCG’s case, the ratio of 3.06x suggests that interest is appropriately covered, which means that debtors may be willing to loan the company more money, giving TCG ample headroom to grow its debt facilities.
Next Steps:
Although TCG’s debt level is towards the higher end of the spectrum, its cash flow coverage seems adequate to meet debt obligations which means its debt is being efficiently utilised. Though its lack of liquidity raises questions over current asset management practices for the mid-cap. This is only a rough assessment of financial health, and I’m sure TCG has company-specific issues impacting its capital structure decisions. You should continue to research Thomas Cook Group to get a better picture of the stock by looking at:
Future Outlook: What are well-informed industry analysts predicting for TCG’s future growth? Take a look at our free research report of analyst consensus for TCG’s outlook.
Valuation: What is TCG worth today? Is the stock undervalued, even when its growth outlook is factored into its intrinsic value? The intrinsic value infographic in our free research report helps visualize whether TCG is currently mispriced by the market.
Other High-Performing Stocks: Are there other stocks that provide better prospects with proven track records? Explore our free list of these great stocks here.
To help readers see pass the short term volatility of the financial market, we aim to bring you a long-term focused research analysis purely driven by fundamental data. Note that our analysis does not factor in the latest price sensitive company announcements.
The author is an independent contributor and at the time of publication had no position in the stocks mentioned.
