
 Yahoo Finance
 Those who invested in AMMB Holdings Berhad (KLSE:AMBANK) a year ago are up 39%
If you want to compound wealth in the stock market, you can do so by buying an index fund. But investors can boost returns by picking market-beating companies to own shares in. To wit, the AMMB Holdings Berhad (KLSE:AMBANK) share price is 35% higher than it was a year ago, much better than the market decline of around 3.2% (not including dividends) in the same period. If it can keep that out-performance up over the long term, investors will do very well! However, the stock hasn't done so well in the longer term, with the stock only up 9.9% in three years.
So let's assess the underlying fundamentals over the last 1 year and see if they've moved in lock-step with shareholder returns.
View our latest analysis for AMMB Holdings Berhad
While markets are a powerful pricing mechanism, share prices reflect investor sentiment, not just underlying business performance. By comparing earnings per share (EPS) and share price changes over time, we can get a feel for how investor attitudes to a company have morphed over time.
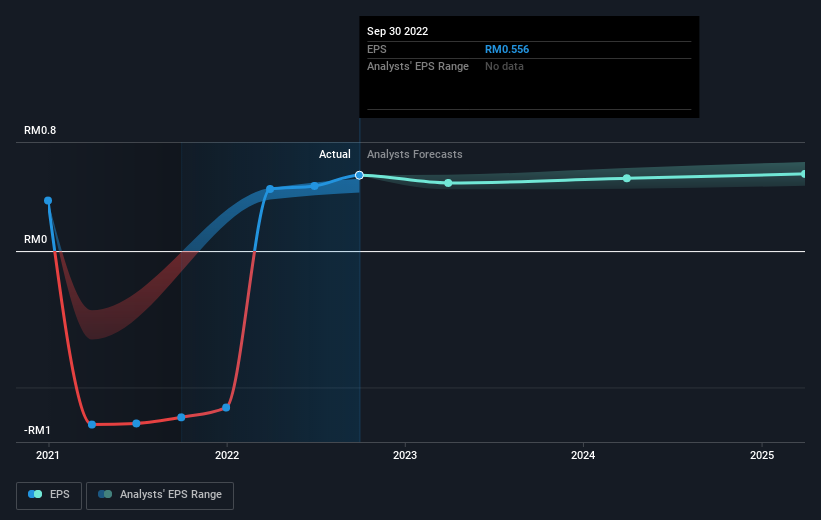
During the last year AMMB Holdings Berhad grew its earnings per share, moving from a loss to a profit.
The result looks like a strong improvement to us, so we're not surprised the market likes the growth. Inflection points like this can be a great time to take a closer look at a company.
You can see below how EPS has changed over time (discover the exact values by clicking on the image).
We know that AMMB Holdings Berhad has improved its bottom line lately, but is it going to grow revenue? If you're interested, you could check this free report showing consensus revenue forecasts.
What About Dividends?
As well as measuring the share price return, investors should also consider the total shareholder return (TSR). Whereas the share price return only reflects the change in the share price, the TSR includes the value of dividends (assuming they were reinvested) and the benefit of any discounted capital raising or spin-off. It's fair to say that the TSR gives a more complete picture for stocks that pay a dividend. We note that for AMMB Holdings Berhad the TSR over the last 1 year was 39%, which is better than the share price return mentioned above. The dividends paid by the company have thusly boosted the total shareholder return.
A Different Perspective
We're pleased to report that AMMB Holdings Berhad shareholders have received a total shareholder return of 39% over one year. Of course, that includes the dividend. That's better than the annualised return of 2% over half a decade, implying that the company is doing better recently. Given the share price momentum remains strong, it might be worth taking a closer look at the stock, lest you miss an opportunity. While it is well worth considering the different impacts that market conditions can have on the share price, there are other factors that are even more important. For example, we've discovered 1 warning sign for AMMB Holdings Berhad that you should be aware of before investing here.
Of course AMMB Holdings Berhad may not be the best stock to buy. So you may wish to see this free collection of growth stocks.
Please note, the market returns quoted in this article reflect the market weighted average returns of stocks that currently trade on MY exchanges.
Have feedback on this article? Concerned about the content? Get in touch with us directly. Alternatively, email editorial-team (at) simplywallst.com.
This article by Simply Wall St is general in nature. We provide commentary based on historical data and analyst forecasts only using an unbiased methodology and our articles are not intended to be financial advice. It does not constitute a recommendation to buy or sell any stock, and does not take account of your objectives, or your financial situation. We aim to bring you long-term focused analysis driven by fundamental data. Note that our analysis may not factor in the latest price-sensitive company announcements or qualitative material. Simply Wall St has no position in any stocks mentioned.
Join A Paid User Research Session
You’ll receive a US$30 Amazon Gift card for 1 hour of your time while helping us build better investing tools for the individual investors like yourself. Sign up here
