
 Yahoo Finance
 Those who invested in Clipper Realty (NYSE:CLPR) a year ago are up 73%
If you want to compound wealth in the stock market, you can do so by buying an index fund. But if you pick the right individual stocks, you could make more than that. For example, the Clipper Realty Inc. (NYSE:CLPR) share price is up 64% in the last 1 year, clearly besting the market return of around 30% (not including dividends). If it can keep that out-performance up over the long term, investors will do very well! Unfortunately the longer term returns are not so good, with the stock falling 33% in the last three years.
So let's investigate and see if the longer term performance of the company has been in line with the underlying business' progress.
Check out our latest analysis for Clipper Realty
Because Clipper Realty made a loss in the last twelve months, we think the market is probably more focussed on revenue and revenue growth, at least for now. Generally speaking, companies without profits are expected to grow revenue every year, and at a good clip. As you can imagine, fast revenue growth, when maintained, often leads to fast profit growth.
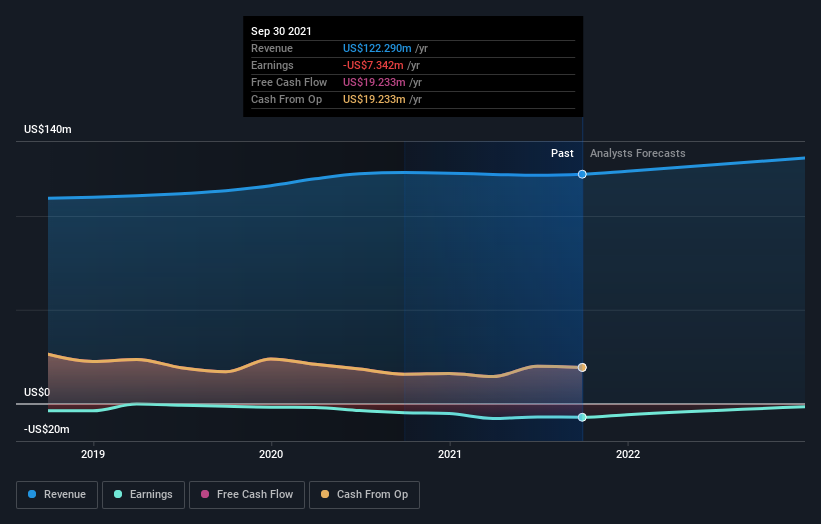
In the last year Clipper Realty saw its revenue shrink by 0.7%. Despite the lack of revenue growth, the stock has returned a solid 64% the last twelve months. To us that means that there isn't a lot of correlation between the past revenue performance and the share price, but a closer look at analyst forecasts and the bottom line may well explain a lot.
You can see how earnings and revenue have changed over time in the image below (click on the chart to see the exact values).
If you are thinking of buying or selling Clipper Realty stock, you should check out this FREE detailed report on its balance sheet.
What About Dividends?
It is important to consider the total shareholder return, as well as the share price return, for any given stock. The TSR is a return calculation that accounts for the value of cash dividends (assuming that any dividend received was reinvested) and the calculated value of any discounted capital raisings and spin-offs. It's fair to say that the TSR gives a more complete picture for stocks that pay a dividend. In the case of Clipper Realty, it has a TSR of 73% for the last 1 year. That exceeds its share price return that we previously mentioned. The dividends paid by the company have thusly boosted the total shareholder return.
A Different Perspective
It's nice to see that Clipper Realty shareholders have gained 73% (in total) over the last year. That's including the dividend. That certainly beats the loss of about 7% per year over three years. The optimist would say this is evidence that the stock has bottomed, and better days lie ahead. While it is well worth considering the different impacts that market conditions can have on the share price, there are other factors that are even more important. Case in point: We've spotted 2 warning signs for Clipper Realty you should be aware of.
We will like Clipper Realty better if we see some big insider buys. While we wait, check out this free list of growing companies with considerable, recent, insider buying.
Please note, the market returns quoted in this article reflect the market weighted average returns of stocks that currently trade on US exchanges.
This article by Simply Wall St is general in nature. We provide commentary based on historical data and analyst forecasts only using an unbiased methodology and our articles are not intended to be financial advice. It does not constitute a recommendation to buy or sell any stock, and does not take account of your objectives, or your financial situation. We aim to bring you long-term focused analysis driven by fundamental data. Note that our analysis may not factor in the latest price-sensitive company announcements or qualitative material. Simply Wall St has no position in any stocks mentioned.
Have feedback on this article? Concerned about the content? Get in touch with us directly. Alternatively, email editorial-team (at) simplywallst.com.
