
 Yahoo Finance
 Those who invested in Frenkel Topping Group (LON:FEN) three years ago are up 186%
It might seem bad, but the worst that can happen when you buy a stock (without leverage) is that its share price goes to zero. But if you buy shares in a really great company, you can more than double your money. To wit, the Frenkel Topping Group Plc (LON:FEN) share price has flown 161% in the last three years. Most would be happy with that. Also pleasing for shareholders was the 16% gain in the last three months.
Now it's worth having a look at the company's fundamentals too, because that will help us determine if the long term shareholder return has matched the performance of the underlying business.
View our latest analysis for Frenkel Topping Group
To paraphrase Benjamin Graham: Over the short term the market is a voting machine, but over the long term it's a weighing machine. One imperfect but simple way to consider how the market perception of a company has shifted is to compare the change in the earnings per share (EPS) with the share price movement.
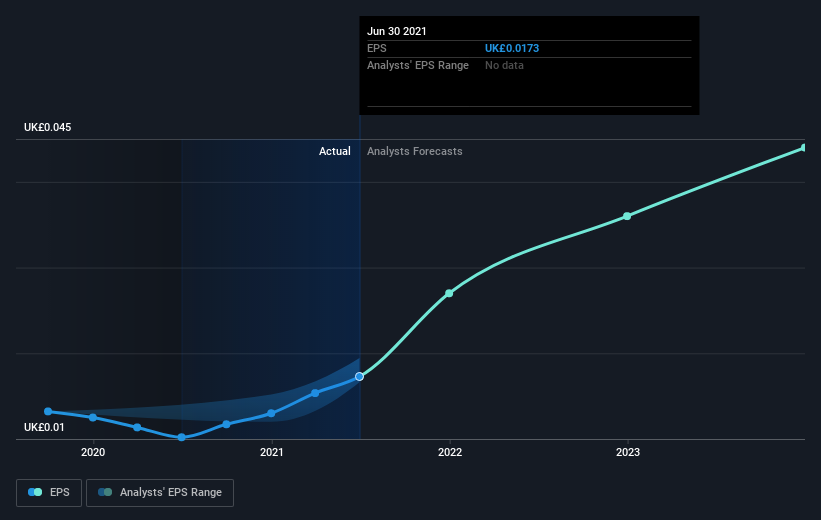
During three years of share price growth, Frenkel Topping Group achieved compound earnings per share growth of 1.5% per year. In comparison, the 38% per year gain in the share price outpaces the EPS growth. This indicates that the market is feeling more optimistic on the stock, after the last few years of progress. That's not necessarily surprising considering the three-year track record of earnings growth. This optimism is also reflected in the fairly generous P/E ratio of 51.33.
The image below shows how EPS has tracked over time (if you click on the image you can see greater detail).
We know that Frenkel Topping Group has improved its bottom line lately, but is it going to grow revenue? This free report showing analyst revenue forecasts should help you figure out if the EPS growth can be sustained.
What About Dividends?
When looking at investment returns, it is important to consider the difference between total shareholder return (TSR) and share price return. The TSR incorporates the value of any spin-offs or discounted capital raisings, along with any dividends, based on the assumption that the dividends are reinvested. Arguably, the TSR gives a more comprehensive picture of the return generated by a stock. We note that for Frenkel Topping Group the TSR over the last 3 years was 186%, which is better than the share price return mentioned above. And there's no prize for guessing that the dividend payments largely explain the divergence!
A Different Perspective
It's good to see that Frenkel Topping Group has rewarded shareholders with a total shareholder return of 93% in the last twelve months. And that does include the dividend. That gain is better than the annual TSR over five years, which is 12%. Therefore it seems like sentiment around the company has been positive lately. In the best case scenario, this may hint at some real business momentum, implying that now could be a great time to delve deeper. It's always interesting to track share price performance over the longer term. But to understand Frenkel Topping Group better, we need to consider many other factors. For instance, we've identified 3 warning signs for Frenkel Topping Group that you should be aware of.
Of course Frenkel Topping Group may not be the best stock to buy. So you may wish to see this free collection of growth stocks.
Please note, the market returns quoted in this article reflect the market weighted average returns of stocks that currently trade on GB exchanges.
This article by Simply Wall St is general in nature. We provide commentary based on historical data and analyst forecasts only using an unbiased methodology and our articles are not intended to be financial advice. It does not constitute a recommendation to buy or sell any stock, and does not take account of your objectives, or your financial situation. We aim to bring you long-term focused analysis driven by fundamental data. Note that our analysis may not factor in the latest price-sensitive company announcements or qualitative material. Simply Wall St has no position in any stocks mentioned.
Have feedback on this article? Concerned about the content? Get in touch with us directly. Alternatively, email editorial-team (at) simplywallst.com.
