
 Yahoo Finance
 Those who invested in Galliford Try Holdings (LON:GFRD) five years ago are up 131%
Ideally, your overall portfolio should beat the market average. A talented investor can beat the market with a diversified portfolio, but even then, some stocks will under-perform. While the Galliford Try Holdings plc (LON:GFRD) share price is down 83% over half a decade, the total return to shareholders (which includes dividends) was 131%. That's better than the market which returned 27% over the same time. We really feel for shareholders in this scenario. It's a good reminder of the importance of diversification, and it's worth keeping in mind there's more to life than money, anyway.
So let's have a look and see if the longer term performance of the company has been in line with the underlying business' progress.
View our latest analysis for Galliford Try Holdings
While markets are a powerful pricing mechanism, share prices reflect investor sentiment, not just underlying business performance. By comparing earnings per share (EPS) and share price changes over time, we can get a feel for how investor attitudes to a company have morphed over time.
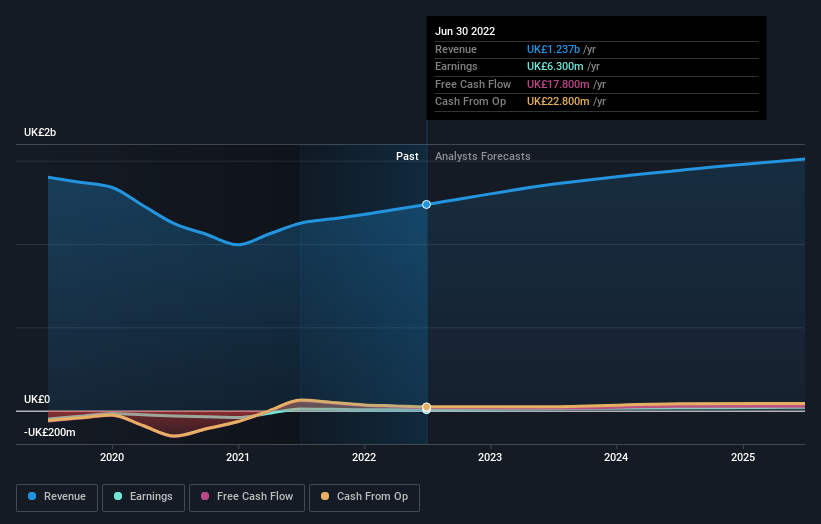
During five years of share price growth, Galliford Try Holdings moved from a loss to profitability. Most would consider that to be a good thing, so it's counter-intuitive to see the share price declining. Other metrics may better explain the share price move.
The most recent dividend was actually lower than it was in the past, so that may have sent the share price lower. On top of that, revenue has declined by 24% per year over the half decade; that could be a red flag for some investors.
You can see below how earnings and revenue have changed over time (discover the exact values by clicking on the image).
We know that Galliford Try Holdings has improved its bottom line over the last three years, but what does the future have in store? This free interactive report on Galliford Try Holdings' balance sheet strength is a great place to start, if you want to investigate the stock further.
What About Dividends?
When looking at investment returns, it is important to consider the difference between total shareholder return (TSR) and share price return. The TSR is a return calculation that accounts for the value of cash dividends (assuming that any dividend received was reinvested) and the calculated value of any discounted capital raisings and spin-offs. So for companies that pay a generous dividend, the TSR is often a lot higher than the share price return. In the case of Galliford Try Holdings, it has a TSR of 131% for the last 5 years. That exceeds its share price return that we previously mentioned. And there's no prize for guessing that the dividend payments largely explain the divergence!
A Different Perspective
We're pleased to report that Galliford Try Holdings shareholders have received a total shareholder return of 2.4% over one year. That's including the dividend. However, the TSR over five years, coming in at 18% per year, is even more impressive. Potential buyers might understandably feel they've missed the opportunity, but it's always possible business is still firing on all cylinders. It's always interesting to track share price performance over the longer term. But to understand Galliford Try Holdings better, we need to consider many other factors. To that end, you should be aware of the 3 warning signs we've spotted with Galliford Try Holdings .
We will like Galliford Try Holdings better if we see some big insider buys. While we wait, check out this free list of growing companies with considerable, recent, insider buying.
Please note, the market returns quoted in this article reflect the market weighted average returns of stocks that currently trade on GB exchanges.
Have feedback on this article? Concerned about the content? Get in touch with us directly. Alternatively, email editorial-team (at) simplywallst.com.
This article by Simply Wall St is general in nature. We provide commentary based on historical data and analyst forecasts only using an unbiased methodology and our articles are not intended to be financial advice. It does not constitute a recommendation to buy or sell any stock, and does not take account of your objectives, or your financial situation. We aim to bring you long-term focused analysis driven by fundamental data. Note that our analysis may not factor in the latest price-sensitive company announcements or qualitative material. Simply Wall St has no position in any stocks mentioned.
Join A Paid User Research Session
You’ll receive a US$30 Amazon Gift card for 1 hour of your time while helping us build better investing tools for the individual investors like yourself. Sign up here
