
 Yahoo Finance
 Those who invested in Joyce (ASX:JYC) five years ago are up 266%
When you buy a stock there is always a possibility that it could drop 100%. But on a lighter note, a good company can see its share price rise well over 100%. For example, the Joyce Corporation Ltd (ASX:JYC) share price has soared 164% in the last half decade. Most would be very happy with that. Also pleasing for shareholders was the 25% gain in the last three months.
Now it's worth having a look at the company's fundamentals too, because that will help us determine if the long term shareholder return has matched the performance of the underlying business.
View our latest analysis for Joyce
While the efficient markets hypothesis continues to be taught by some, it has been proven that markets are over-reactive dynamic systems, and investors are not always rational. One way to examine how market sentiment has changed over time is to look at the interaction between a company's share price and its earnings per share (EPS).
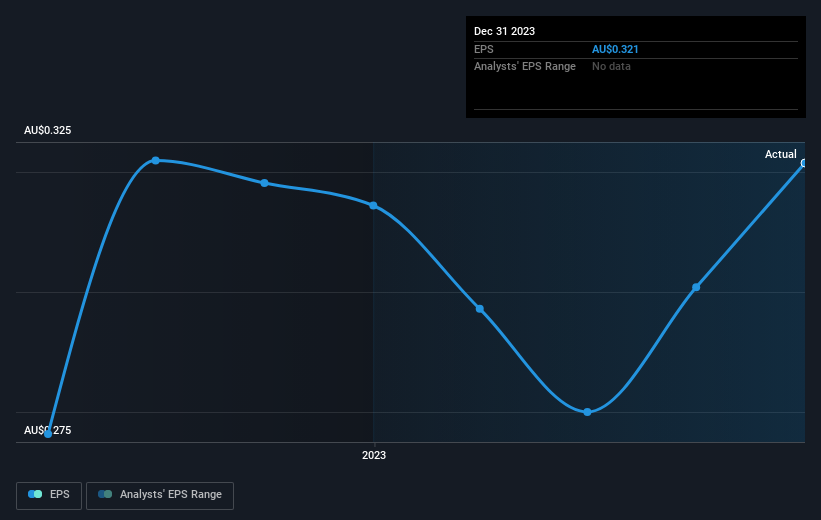
Over half a decade, Joyce managed to grow its earnings per share at 19% a year. So the EPS growth rate is rather close to the annualized share price gain of 21% per year. That suggests that the market sentiment around the company hasn't changed much over that time. In fact, the share price seems to largely reflect the EPS growth.
You can see below how EPS has changed over time (discover the exact values by clicking on the image).
It might be well worthwhile taking a look at our free report on Joyce's earnings, revenue and cash flow.
What About Dividends?
As well as measuring the share price return, investors should also consider the total shareholder return (TSR). Whereas the share price return only reflects the change in the share price, the TSR includes the value of dividends (assuming they were reinvested) and the benefit of any discounted capital raising or spin-off. It's fair to say that the TSR gives a more complete picture for stocks that pay a dividend. We note that for Joyce the TSR over the last 5 years was 266%, which is better than the share price return mentioned above. This is largely a result of its dividend payments!
A Different Perspective
We're pleased to report that Joyce shareholders have received a total shareholder return of 51% over one year. That's including the dividend. Since the one-year TSR is better than the five-year TSR (the latter coming in at 30% per year), it would seem that the stock's performance has improved in recent times. Someone with an optimistic perspective could view the recent improvement in TSR as indicating that the business itself is getting better with time. It's always interesting to track share price performance over the longer term. But to understand Joyce better, we need to consider many other factors. For example, we've discovered 2 warning signs for Joyce that you should be aware of before investing here.
If you would prefer to check out another company -- one with potentially superior financials -- then do not miss this free list of companies that have proven they can grow earnings.
Please note, the market returns quoted in this article reflect the market weighted average returns of stocks that currently trade on Australian exchanges.
Have feedback on this article? Concerned about the content? Get in touch with us directly. Alternatively, email editorial-team (at) simplywallst.com.
This article by Simply Wall St is general in nature. We provide commentary based on historical data and analyst forecasts only using an unbiased methodology and our articles are not intended to be financial advice. It does not constitute a recommendation to buy or sell any stock, and does not take account of your objectives, or your financial situation. We aim to bring you long-term focused analysis driven by fundamental data. Note that our analysis may not factor in the latest price-sensitive company announcements or qualitative material. Simply Wall St has no position in any stocks mentioned.
