
 Yahoo Finance
 Those who invested in Kingfisher (LON:KGF) three years ago are up 77%
While Kingfisher plc (LON:KGF) shareholders are probably generally happy, the stock hasn't had particularly good run recently, with the share price falling 14% in the last quarter. But that doesn't change the fact that the returns over the last three years have been pleasing. To wit, the share price did better than an index fund, climbing 62% during that period.
So let's investigate and see if the longer term performance of the company has been in line with the underlying business' progress.
View our latest analysis for Kingfisher
There is no denying that markets are sometimes efficient, but prices do not always reflect underlying business performance. One imperfect but simple way to consider how the market perception of a company has shifted is to compare the change in the earnings per share (EPS) with the share price movement.
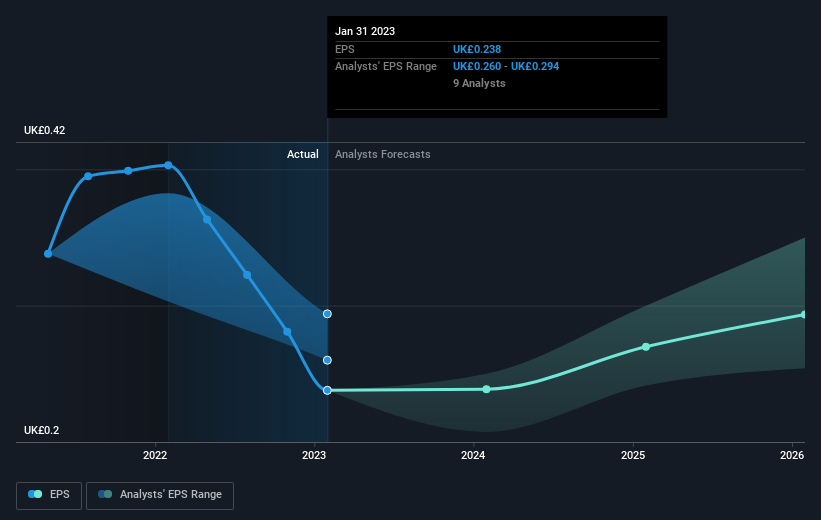
Kingfisher was able to grow its EPS at 300% per year over three years, sending the share price higher. This EPS growth is higher than the 17% average annual increase in the share price. So one could reasonably conclude that the market has cooled on the stock. This cautious sentiment is reflected in its (fairly low) P/E ratio of 10.31.
You can see how EPS has changed over time in the image below (click on the chart to see the exact values).
We know that Kingfisher has improved its bottom line over the last three years, but what does the future have in store? It might be well worthwhile taking a look at our free report on how its financial position has changed over time.
What About Dividends?
When looking at investment returns, it is important to consider the difference between total shareholder return (TSR) and share price return. The TSR is a return calculation that accounts for the value of cash dividends (assuming that any dividend received was reinvested) and the calculated value of any discounted capital raisings and spin-offs. So for companies that pay a generous dividend, the TSR is often a lot higher than the share price return. As it happens, Kingfisher's TSR for the last 3 years was 77%, which exceeds the share price return mentioned earlier. The dividends paid by the company have thusly boosted the total shareholder return.
A Different Perspective
It's nice to see that Kingfisher shareholders have received a total shareholder return of 9.5% over the last year. That's including the dividend. That's better than the annualised return of 0.3% over half a decade, implying that the company is doing better recently. Given the share price momentum remains strong, it might be worth taking a closer look at the stock, lest you miss an opportunity. It's always interesting to track share price performance over the longer term. But to understand Kingfisher better, we need to consider many other factors. For instance, we've identified 2 warning signs for Kingfisher that you should be aware of.
But note: Kingfisher may not be the best stock to buy. So take a peek at this free list of interesting companies with past earnings growth (and further growth forecast).
Please note, the market returns quoted in this article reflect the market weighted average returns of stocks that currently trade on British exchanges.
Have feedback on this article? Concerned about the content? Get in touch with us directly. Alternatively, email editorial-team (at) simplywallst.com.
This article by Simply Wall St is general in nature. We provide commentary based on historical data and analyst forecasts only using an unbiased methodology and our articles are not intended to be financial advice. It does not constitute a recommendation to buy or sell any stock, and does not take account of your objectives, or your financial situation. We aim to bring you long-term focused analysis driven by fundamental data. Note that our analysis may not factor in the latest price-sensitive company announcements or qualitative material. Simply Wall St has no position in any stocks mentioned.
Join A Paid User Research Session
You’ll receive a US$30 Amazon Gift card for 1 hour of your time while helping us build better investing tools for the individual investors like yourself. Sign up here
