
 Yahoo Finance
 Those who invested in Koninklijke BAM Groep (AMS:BAMNB) a year ago are up 114%
The most you can lose on any stock (assuming you don't use leverage) is 100% of your money. But when you pick a company that is really flourishing, you can make more than 100%. For example, the Koninklijke BAM Groep nv (AMS:BAMNB) share price had more than doubled in just one year - up 104%. On top of that, the share price is up 17% in about a quarter. But this move may well have been assisted by the reasonably buoyant market (up 8.1% in 90 days). It is also impressive that the stock is up 68% over three years, adding to the sense that it is a real winner.
With that in mind, it's worth seeing if the company's underlying fundamentals have been the driver of long term performance, or if there are some discrepancies.
View our latest analysis for Koninklijke BAM Groep
In his essay The Superinvestors of Graham-and-Doddsville Warren Buffett described how share prices do not always rationally reflect the value of a business. By comparing earnings per share (EPS) and share price changes over time, we can get a feel for how investor attitudes to a company have morphed over time.
During the last year, Koninklijke BAM Groep actually saw its earnings per share drop 1.9%.
We don't think that the decline in earnings per share is a good measure of the business over the last twelve months. Since the change in EPS doesn't seem to correlate with the change in share price, it's worth taking a look at other metrics.
For starters, we suspect the share price has been buoyed by the dividend, which was increased during the year. Income-seeking investors probably helped bid up the stock price.
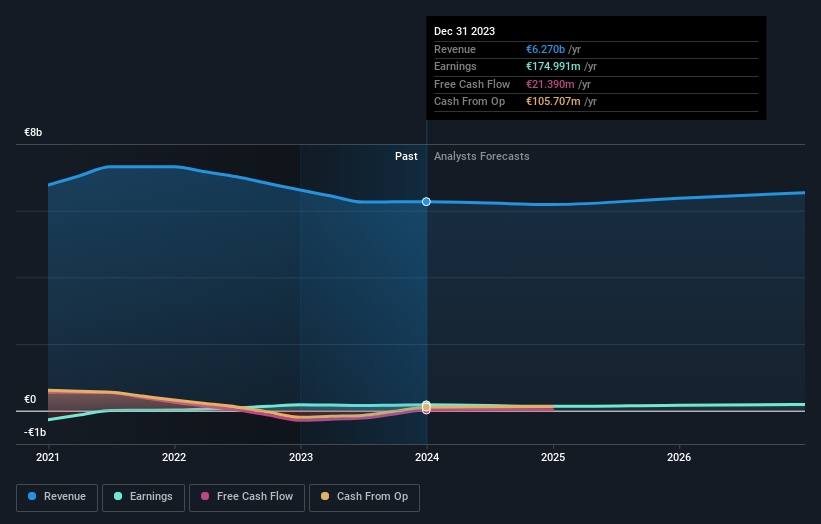
The graphic below depicts how earnings and revenue have changed over time (unveil the exact values by clicking on the image).
We know that Koninklijke BAM Groep has improved its bottom line over the last three years, but what does the future have in store? You can see how its balance sheet has strengthened (or weakened) over time in this free interactive graphic.
What About Dividends?
It is important to consider the total shareholder return, as well as the share price return, for any given stock. The TSR is a return calculation that accounts for the value of cash dividends (assuming that any dividend received was reinvested) and the calculated value of any discounted capital raisings and spin-offs. It's fair to say that the TSR gives a more complete picture for stocks that pay a dividend. As it happens, Koninklijke BAM Groep's TSR for the last 1 year was 114%, which exceeds the share price return mentioned earlier. This is largely a result of its dividend payments!
A Different Perspective
We're pleased to report that Koninklijke BAM Groep shareholders have received a total shareholder return of 114% over one year. Of course, that includes the dividend. That gain is better than the annual TSR over five years, which is 3%. Therefore it seems like sentiment around the company has been positive lately. Someone with an optimistic perspective could view the recent improvement in TSR as indicating that the business itself is getting better with time. It's always interesting to track share price performance over the longer term. But to understand Koninklijke BAM Groep better, we need to consider many other factors. To that end, you should learn about the 3 warning signs we've spotted with Koninklijke BAM Groep (including 1 which shouldn't be ignored) .
If you would prefer to check out another company -- one with potentially superior financials -- then do not miss this free list of companies that have proven they can grow earnings.
Please note, the market returns quoted in this article reflect the market weighted average returns of stocks that currently trade on Dutch exchanges.
Have feedback on this article? Concerned about the content? Get in touch with us directly. Alternatively, email editorial-team (at) simplywallst.com.
This article by Simply Wall St is general in nature. We provide commentary based on historical data and analyst forecasts only using an unbiased methodology and our articles are not intended to be financial advice. It does not constitute a recommendation to buy or sell any stock, and does not take account of your objectives, or your financial situation. We aim to bring you long-term focused analysis driven by fundamental data. Note that our analysis may not factor in the latest price-sensitive company announcements or qualitative material. Simply Wall St has no position in any stocks mentioned.
