
 Yahoo Finance
 Those who invested in Liontrust Asset Management (LON:LIO) five years ago are up 351%
It hasn't been the best quarter for Liontrust Asset Management PLC (LON:LIO) shareholders, since the share price has fallen 28% in that time. But that doesn't change the fact that shareholders have received really good returns over the last five years. In fact, the share price is 284% higher today. So while it's never fun to see a share price fall, it's important to look at a longer time horizon. Of course, that doesn't necessarily mean it's cheap now.
So let's investigate and see if the longer term performance of the company has been in line with the underlying business' progress.
Check out our latest analysis for Liontrust Asset Management
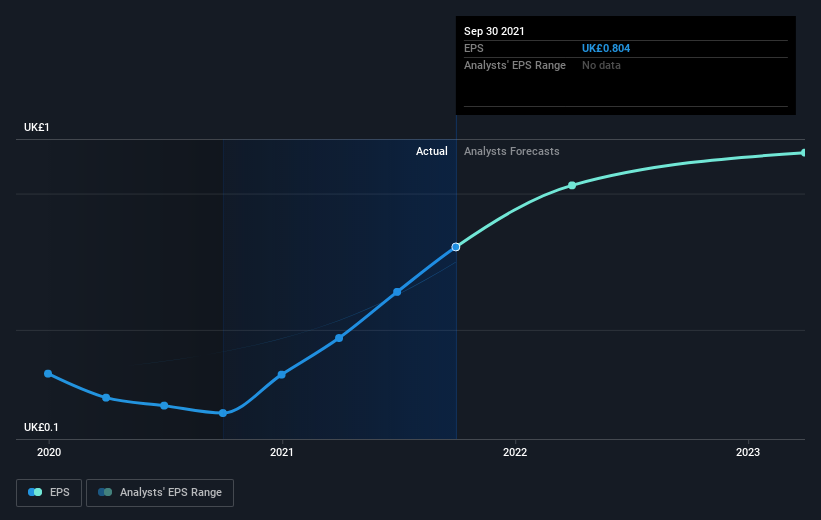
While markets are a powerful pricing mechanism, share prices reflect investor sentiment, not just underlying business performance. One way to examine how market sentiment has changed over time is to look at the interaction between a company's share price and its earnings per share (EPS).
During five years of share price growth, Liontrust Asset Management achieved compound earnings per share (EPS) growth of 44% per year. The EPS growth is more impressive than the yearly share price gain of 31% over the same period. So it seems the market isn't so enthusiastic about the stock these days.
The image below shows how EPS has tracked over time (if you click on the image you can see greater detail).
We know that Liontrust Asset Management has improved its bottom line over the last three years, but what does the future have in store? You can see how its balance sheet has strengthened (or weakened) over time in this free interactive graphic.
What About Dividends?
When looking at investment returns, it is important to consider the difference between total shareholder return (TSR) and share price return. Whereas the share price return only reflects the change in the share price, the TSR includes the value of dividends (assuming they were reinvested) and the benefit of any discounted capital raising or spin-off. It's fair to say that the TSR gives a more complete picture for stocks that pay a dividend. In the case of Liontrust Asset Management, it has a TSR of 351% for the last 5 years. That exceeds its share price return that we previously mentioned. This is largely a result of its dividend payments!
A Different Perspective
We're pleased to report that Liontrust Asset Management shareholders have received a total shareholder return of 21% over one year. That's including the dividend. However, the TSR over five years, coming in at 35% per year, is even more impressive. Potential buyers might understandably feel they've missed the opportunity, but it's always possible business is still firing on all cylinders. I find it very interesting to look at share price over the long term as a proxy for business performance. But to truly gain insight, we need to consider other information, too. For example, we've discovered 3 warning signs for Liontrust Asset Management that you should be aware of before investing here.
If you are like me, then you will not want to miss this free list of growing companies that insiders are buying.
Please note, the market returns quoted in this article reflect the market weighted average returns of stocks that currently trade on GB exchanges.
Have feedback on this article? Concerned about the content? Get in touch with us directly. Alternatively, email editorial-team (at) simplywallst.com.
This article by Simply Wall St is general in nature. We provide commentary based on historical data and analyst forecasts only using an unbiased methodology and our articles are not intended to be financial advice. It does not constitute a recommendation to buy or sell any stock, and does not take account of your objectives, or your financial situation. We aim to bring you long-term focused analysis driven by fundamental data. Note that our analysis may not factor in the latest price-sensitive company announcements or qualitative material. Simply Wall St has no position in any stocks mentioned.
