
 Yahoo Finance
 Those who invested in Norfolk Southern (NYSE:NSC) five years ago are up 31%
The main point of investing for the long term is to make money. Better yet, you'd like to see the share price move up more than the market average. Unfortunately for shareholders, while the Norfolk Southern Corporation (NYSE:NSC) share price is up 18% in the last five years, that's less than the market return. Looking at the last year alone, the stock is up 14%.
With that in mind, it's worth seeing if the company's underlying fundamentals have been the driver of long term performance, or if there are some discrepancies.
See our latest analysis for Norfolk Southern
In his essay The Superinvestors of Graham-and-Doddsville Warren Buffett described how share prices do not always rationally reflect the value of a business. One flawed but reasonable way to assess how sentiment around a company has changed is to compare the earnings per share (EPS) with the share price.
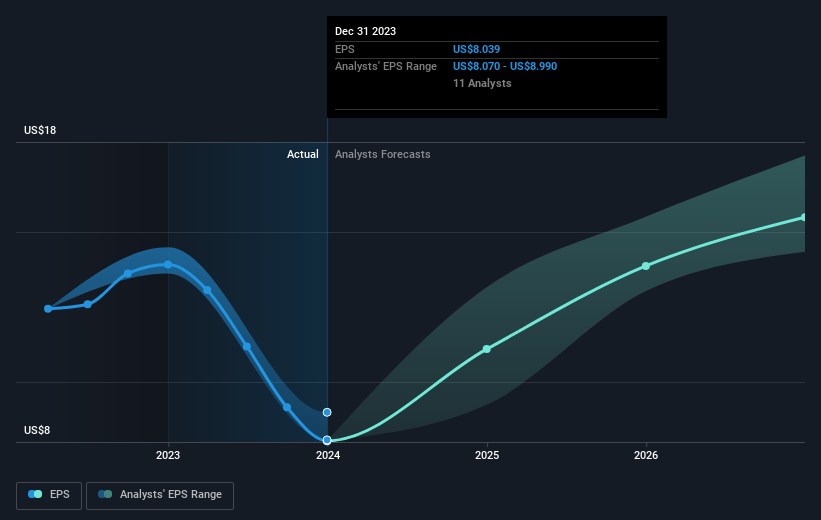
During five years of share price growth, Norfolk Southern actually saw its EPS drop 3.4% per year.
Since EPS is down a bit, and the share price is up, it's probably that the market previously had some concerns about the company, but the reality has been better than feared. Having said that, if the EPS falls continue we'd be surprised to see a sustained increase in share price.
The image below shows how EPS has tracked over time (if you click on the image you can see greater detail).
It might be well worthwhile taking a look at our free report on Norfolk Southern's earnings, revenue and cash flow.
What About Dividends?
It is important to consider the total shareholder return, as well as the share price return, for any given stock. Whereas the share price return only reflects the change in the share price, the TSR includes the value of dividends (assuming they were reinvested) and the benefit of any discounted capital raising or spin-off. So for companies that pay a generous dividend, the TSR is often a lot higher than the share price return. As it happens, Norfolk Southern's TSR for the last 5 years was 31%, which exceeds the share price return mentioned earlier. The dividends paid by the company have thusly boosted the total shareholder return.
A Different Perspective
Norfolk Southern provided a TSR of 17% over the last twelve months. But that was short of the market average. The silver lining is that the gain was actually better than the average annual return of 5% per year over five year. This suggests the company might be improving over time. It's always interesting to track share price performance over the longer term. But to understand Norfolk Southern better, we need to consider many other factors. Case in point: We've spotted 4 warning signs for Norfolk Southern you should be aware of, and 1 of them shouldn't be ignored.
But note: Norfolk Southern may not be the best stock to buy. So take a peek at this free list of interesting companies with past earnings growth (and further growth forecast).
Please note, the market returns quoted in this article reflect the market weighted average returns of stocks that currently trade on American exchanges.
Have feedback on this article? Concerned about the content? Get in touch with us directly. Alternatively, email editorial-team (at) simplywallst.com.
This article by Simply Wall St is general in nature. We provide commentary based on historical data and analyst forecasts only using an unbiased methodology and our articles are not intended to be financial advice. It does not constitute a recommendation to buy or sell any stock, and does not take account of your objectives, or your financial situation. We aim to bring you long-term focused analysis driven by fundamental data. Note that our analysis may not factor in the latest price-sensitive company announcements or qualitative material. Simply Wall St has no position in any stocks mentioned.
