
 Yahoo Finance
 Those who invested in Palo Alto Networks (NASDAQ:PANW) five years ago are up 239%
It hasn't been the best quarter for Palo Alto Networks, Inc. (NASDAQ:PANW) shareholders, since the share price has fallen 18% in that time. But that scarcely detracts from the really solid long term returns generated by the company over five years. We think most investors would be happy with the 239% return, over that period. To some, the recent pullback wouldn't be surprising after such a fast rise. Of course, that doesn't necessarily mean it's cheap now.
With that in mind, it's worth seeing if the company's underlying fundamentals have been the driver of long term performance, or if there are some discrepancies.
See our latest analysis for Palo Alto Networks
While markets are a powerful pricing mechanism, share prices reflect investor sentiment, not just underlying business performance. One flawed but reasonable way to assess how sentiment around a company has changed is to compare the earnings per share (EPS) with the share price.
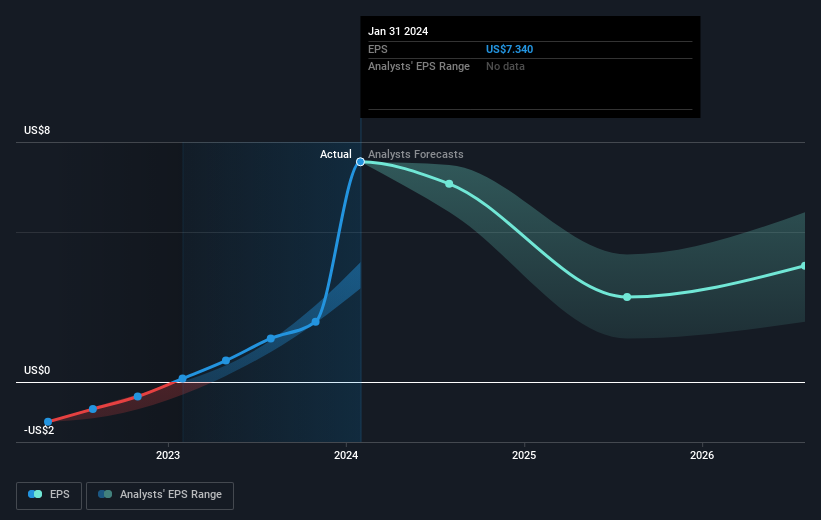
During the five years of share price growth, Palo Alto Networks moved from a loss to profitability. That kind of transition can be an inflection point that justifies a strong share price gain, just as we have seen here.
The company's earnings per share (over time) is depicted in the image below (click to see the exact numbers).
We know that Palo Alto Networks has improved its bottom line over the last three years, but what does the future have in store? You can see how its balance sheet has strengthened (or weakened) over time in this free interactive graphic.
A Different Perspective
It's nice to see that Palo Alto Networks shareholders have received a total shareholder return of 44% over the last year. That gain is better than the annual TSR over five years, which is 28%. Therefore it seems like sentiment around the company has been positive lately. Given the share price momentum remains strong, it might be worth taking a closer look at the stock, lest you miss an opportunity. It's always interesting to track share price performance over the longer term. But to understand Palo Alto Networks better, we need to consider many other factors. To that end, you should learn about the 2 warning signs we've spotted with Palo Alto Networks (including 1 which is a bit unpleasant) .
But note: Palo Alto Networks may not be the best stock to buy. So take a peek at this free list of interesting companies with past earnings growth (and further growth forecast).
Please note, the market returns quoted in this article reflect the market weighted average returns of stocks that currently trade on American exchanges.
Have feedback on this article? Concerned about the content? Get in touch with us directly. Alternatively, email editorial-team (at) simplywallst.com.
This article by Simply Wall St is general in nature. We provide commentary based on historical data and analyst forecasts only using an unbiased methodology and our articles are not intended to be financial advice. It does not constitute a recommendation to buy or sell any stock, and does not take account of your objectives, or your financial situation. We aim to bring you long-term focused analysis driven by fundamental data. Note that our analysis may not factor in the latest price-sensitive company announcements or qualitative material. Simply Wall St has no position in any stocks mentioned.
