
 Yahoo Finance
 Those who invested in Paychex (NASDAQ:PAYX) five years ago are up 154%
The most you can lose on any stock (assuming you don't use leverage) is 100% of your money. But on the bright side, if you buy shares in a high quality company at the right price, you can gain well over 100%. For instance, the price of Paychex, Inc. (NASDAQ:PAYX) stock is up an impressive 118% over the last five years. Meanwhile the share price is 1.0% higher than it was a week ago.
Now it's worth having a look at the company's fundamentals too, because that will help us determine if the long term shareholder return has matched the performance of the underlying business.
Check out our latest analysis for Paychex
There is no denying that markets are sometimes efficient, but prices do not always reflect underlying business performance. One flawed but reasonable way to assess how sentiment around a company has changed is to compare the earnings per share (EPS) with the share price.
During five years of share price growth, Paychex achieved compound earnings per share (EPS) growth of 9.8% per year. This EPS growth is lower than the 17% average annual increase in the share price. This suggests that market participants hold the company in higher regard, these days. That's not necessarily surprising considering the five-year track record of earnings growth.
You can see below how EPS has changed over time (discover the exact values by clicking on the image).
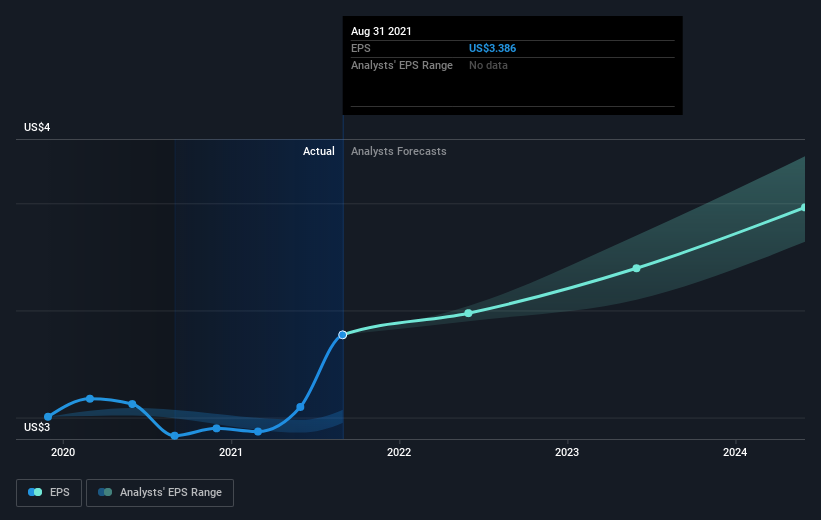
We know that Paychex has improved its bottom line lately, but is it going to grow revenue? Check if analysts think Paychex will grow revenue in the future.
What About Dividends?
When looking at investment returns, it is important to consider the difference between total shareholder return (TSR) and share price return. Whereas the share price return only reflects the change in the share price, the TSR includes the value of dividends (assuming they were reinvested) and the benefit of any discounted capital raising or spin-off. It's fair to say that the TSR gives a more complete picture for stocks that pay a dividend. As it happens, Paychex's TSR for the last 5 years was 154%, which exceeds the share price return mentioned earlier. And there's no prize for guessing that the dividend payments largely explain the divergence!
A Different Perspective
We're pleased to report that Paychex shareholders have received a total shareholder return of 37% over one year. Of course, that includes the dividend. That's better than the annualised return of 20% over half a decade, implying that the company is doing better recently. Someone with an optimistic perspective could view the recent improvement in TSR as indicating that the business itself is getting better with time. While it is well worth considering the different impacts that market conditions can have on the share price, there are other factors that are even more important. Take risks, for example - Paychex has 1 warning sign we think you should be aware of.
Of course Paychex may not be the best stock to buy. So you may wish to see this free collection of growth stocks.
Please note, the market returns quoted in this article reflect the market weighted average returns of stocks that currently trade on US exchanges.
This article by Simply Wall St is general in nature. We provide commentary based on historical data and analyst forecasts only using an unbiased methodology and our articles are not intended to be financial advice. It does not constitute a recommendation to buy or sell any stock, and does not take account of your objectives, or your financial situation. We aim to bring you long-term focused analysis driven by fundamental data. Note that our analysis may not factor in the latest price-sensitive company announcements or qualitative material. Simply Wall St has no position in any stocks mentioned.
Have feedback on this article? Concerned about the content? Get in touch with us directly. Alternatively, email editorial-team (at) simplywallst.com.
