
 Yahoo Finance
 Those who invested in Ramsdens Holdings (LON:RFX) three years ago are up 55%
By buying an index fund, investors can approximate the average market return. But if you buy good businesses at attractive prices, your portfolio returns could exceed the average market return. For example, the Ramsdens Holdings PLC (LON:RFX) share price is up 45% in the last three years, clearly besting the market return of around 1.1% (not including dividends). On the other hand, the returns haven't been quite so good recently, with shareholders up just 6.9% , including dividends .
With that in mind, it's worth seeing if the company's underlying fundamentals have been the driver of long term performance, or if there are some discrepancies.
Check out our latest analysis for Ramsdens Holdings
To quote Buffett, 'Ships will sail around the world but the Flat Earth Society will flourish. There will continue to be wide discrepancies between price and value in the marketplace...' By comparing earnings per share (EPS) and share price changes over time, we can get a feel for how investor attitudes to a company have morphed over time.
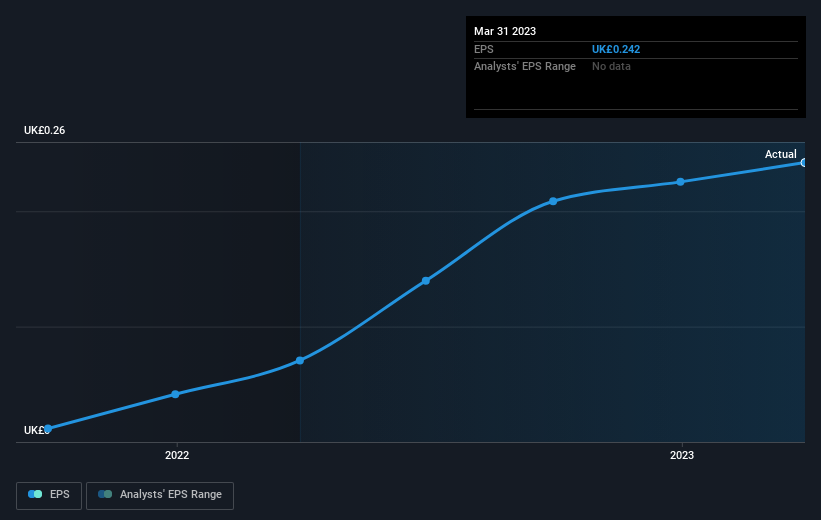
Ramsdens Holdings was able to grow its EPS at 4.2% per year over three years, sending the share price higher. This EPS growth is lower than the 13% average annual increase in the share price. This indicates that the market is feeling more optimistic on the stock, after the last few years of progress. It is quite common to see investors become enamoured with a business, after a few years of solid progress.
The image below shows how EPS has tracked over time (if you click on the image you can see greater detail).
We know that Ramsdens Holdings has improved its bottom line lately, but is it going to grow revenue? This free report showing analyst revenue forecasts should help you figure out if the EPS growth can be sustained.
What About Dividends?
It is important to consider the total shareholder return, as well as the share price return, for any given stock. Whereas the share price return only reflects the change in the share price, the TSR includes the value of dividends (assuming they were reinvested) and the benefit of any discounted capital raising or spin-off. It's fair to say that the TSR gives a more complete picture for stocks that pay a dividend. In the case of Ramsdens Holdings, it has a TSR of 55% for the last 3 years. That exceeds its share price return that we previously mentioned. The dividends paid by the company have thusly boosted the total shareholder return.
A Different Perspective
It's good to see that Ramsdens Holdings has rewarded shareholders with a total shareholder return of 6.9% in the last twelve months. Of course, that includes the dividend. That's better than the annualised return of 6% over half a decade, implying that the company is doing better recently. In the best case scenario, this may hint at some real business momentum, implying that now could be a great time to delve deeper. I find it very interesting to look at share price over the long term as a proxy for business performance. But to truly gain insight, we need to consider other information, too. To that end, you should learn about the 3 warning signs we've spotted with Ramsdens Holdings (including 1 which is a bit concerning) .
If you are like me, then you will not want to miss this free list of growing companies that insiders are buying.
Please note, the market returns quoted in this article reflect the market weighted average returns of stocks that currently trade on British exchanges.
Have feedback on this article? Concerned about the content? Get in touch with us directly. Alternatively, email editorial-team (at) simplywallst.com.
This article by Simply Wall St is general in nature. We provide commentary based on historical data and analyst forecasts only using an unbiased methodology and our articles are not intended to be financial advice. It does not constitute a recommendation to buy or sell any stock, and does not take account of your objectives, or your financial situation. We aim to bring you long-term focused analysis driven by fundamental data. Note that our analysis may not factor in the latest price-sensitive company announcements or qualitative material. Simply Wall St has no position in any stocks mentioned.
