
 Yahoo Finance
 Those who invested in Raymond James Financial (NYSE:RJF) five years ago are up 135%
When you buy a stock there is always a possibility that it could drop 100%. But on the bright side, you can make far more than 100% on a really good stock. One great example is Raymond James Financial, Inc. (NYSE:RJF) which saw its share price drive 117% higher over five years. Also pleasing for shareholders was the 15% gain in the last three months. But this could be related to the strong market, which is up 8.9% in the last three months.
With that in mind, it's worth seeing if the company's underlying fundamentals have been the driver of long term performance, or if there are some discrepancies.
View our latest analysis for Raymond James Financial
To quote Buffett, 'Ships will sail around the world but the Flat Earth Society will flourish. There will continue to be wide discrepancies between price and value in the marketplace...' One flawed but reasonable way to assess how sentiment around a company has changed is to compare the earnings per share (EPS) with the share price.
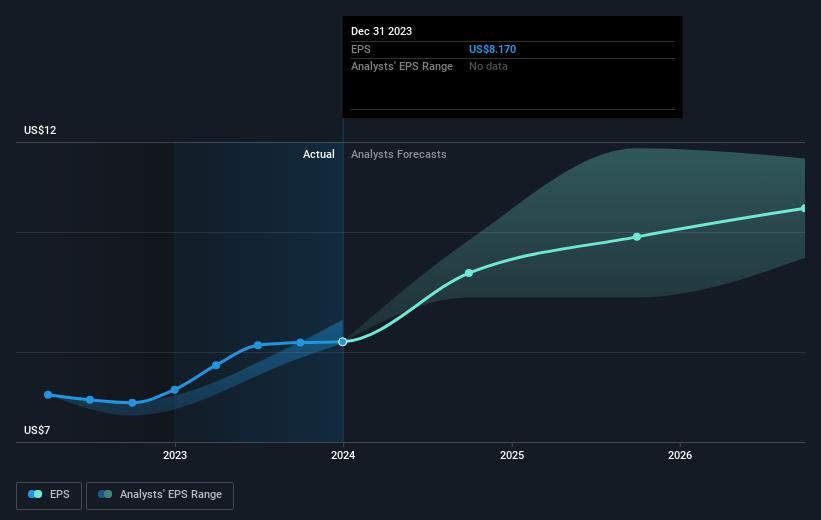
During five years of share price growth, Raymond James Financial achieved compound earnings per share (EPS) growth of 13% per year. This EPS growth is slower than the share price growth of 17% per year, over the same period. This suggests that market participants hold the company in higher regard, these days. And that's hardly shocking given the track record of growth.
You can see how EPS has changed over time in the image below (click on the chart to see the exact values).
We know that Raymond James Financial has improved its bottom line lately, but is it going to grow revenue? You could check out this free report showing analyst revenue forecasts.
What About Dividends?
It is important to consider the total shareholder return, as well as the share price return, for any given stock. Whereas the share price return only reflects the change in the share price, the TSR includes the value of dividends (assuming they were reinvested) and the benefit of any discounted capital raising or spin-off. Arguably, the TSR gives a more comprehensive picture of the return generated by a stock. We note that for Raymond James Financial the TSR over the last 5 years was 135%, which is better than the share price return mentioned above. And there's no prize for guessing that the dividend payments largely explain the divergence!
A Different Perspective
It's nice to see that Raymond James Financial shareholders have received a total shareholder return of 40% over the last year. That's including the dividend. That gain is better than the annual TSR over five years, which is 19%. Therefore it seems like sentiment around the company has been positive lately. Given the share price momentum remains strong, it might be worth taking a closer look at the stock, lest you miss an opportunity. Most investors take the time to check the data on insider transactions. You can click here to see if insiders have been buying or selling.
We will like Raymond James Financial better if we see some big insider buys. While we wait, check out this free list of growing companies with considerable, recent, insider buying.
Please note, the market returns quoted in this article reflect the market weighted average returns of stocks that currently trade on American exchanges.
Have feedback on this article? Concerned about the content? Get in touch with us directly. Alternatively, email editorial-team (at) simplywallst.com.
This article by Simply Wall St is general in nature. We provide commentary based on historical data and analyst forecasts only using an unbiased methodology and our articles are not intended to be financial advice. It does not constitute a recommendation to buy or sell any stock, and does not take account of your objectives, or your financial situation. We aim to bring you long-term focused analysis driven by fundamental data. Note that our analysis may not factor in the latest price-sensitive company announcements or qualitative material. Simply Wall St has no position in any stocks mentioned.
