
 Yahoo Finance
 Those who invested in RediShred Capital (CVE:KUT) three years ago are up 45%
By buying an index fund, investors can approximate the average market return. But many of us dare to dream of bigger returns, and build a portfolio ourselves. For example, the RediShred Capital Corp. (CVE:KUT) share price is up 45% in the last three years, clearly besting the market return of around 27% (not including dividends). However, more recent returns haven't been as impressive as that, with the stock returning just 2.5% in the last year.
Now it's worth having a look at the company's fundamentals too, because that will help us determine if the long term shareholder return has matched the performance of the underlying business.
See our latest analysis for RediShred Capital
There is no denying that markets are sometimes efficient, but prices do not always reflect underlying business performance. One way to examine how market sentiment has changed over time is to look at the interaction between a company's share price and its earnings per share (EPS).
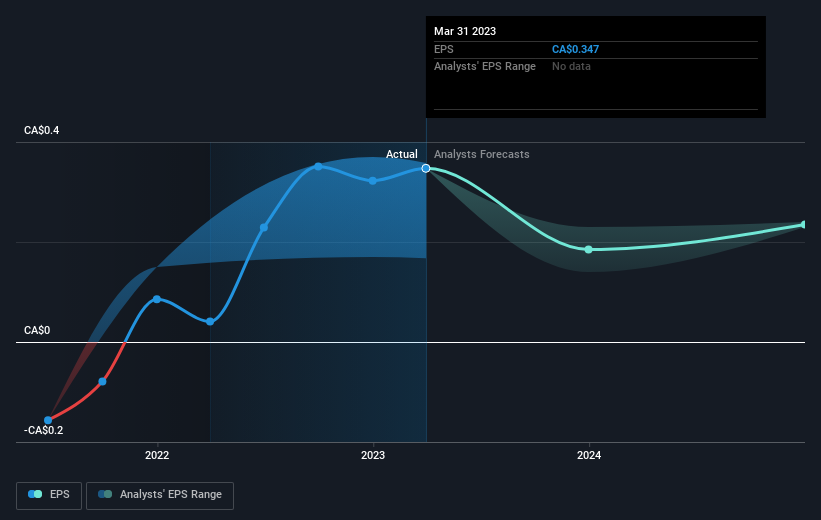
RediShred Capital was able to grow its EPS at 32% per year over three years, sending the share price higher. This EPS growth is higher than the 13% average annual increase in the share price. So one could reasonably conclude that the market has cooled on the stock. This cautious sentiment is reflected in its (fairly low) P/E ratio of 10.66.
The graphic below depicts how EPS has changed over time (unveil the exact values by clicking on the image).
We know that RediShred Capital has improved its bottom line over the last three years, but what does the future have in store? If you are thinking of buying or selling RediShred Capital stock, you should check out this FREE detailed report on its balance sheet.
A Different Perspective
RediShred Capital provided a TSR of 2.5% over the last twelve months. But that was short of the market average. On the bright side, that's still a gain, and it's actually better than the average return of 0.2% over half a decade This could indicate that the company is winning over new investors, as it pursues its strategy. It's always interesting to track share price performance over the longer term. But to understand RediShred Capital better, we need to consider many other factors. To that end, you should learn about the 3 warning signs we've spotted with RediShred Capital (including 1 which is a bit concerning) .
If you are like me, then you will not want to miss this free list of growing companies that insiders are buying.
Please note, the market returns quoted in this article reflect the market weighted average returns of stocks that currently trade on Canadian exchanges.
Have feedback on this article? Concerned about the content? Get in touch with us directly. Alternatively, email editorial-team (at) simplywallst.com.
This article by Simply Wall St is general in nature. We provide commentary based on historical data and analyst forecasts only using an unbiased methodology and our articles are not intended to be financial advice. It does not constitute a recommendation to buy or sell any stock, and does not take account of your objectives, or your financial situation. We aim to bring you long-term focused analysis driven by fundamental data. Note that our analysis may not factor in the latest price-sensitive company announcements or qualitative material. Simply Wall St has no position in any stocks mentioned.
