
 Yahoo Finance
 Those who invested in Regal Rexnord (NYSE:RRX) three years ago are up 105%
One simple way to benefit from the stock market is to buy an index fund. But if you pick the right individual stocks, you could make more than that. For example, the Regal Rexnord Corporation (NYSE:RRX) share price is up 89% in the last three years, clearly besting the market return of around 38% (not including dividends).
With that in mind, it's worth seeing if the company's underlying fundamentals have been the driver of long term performance, or if there are some discrepancies.
See our latest analysis for Regal Rexnord
In his essay The Superinvestors of Graham-and-Doddsville Warren Buffett described how share prices do not always rationally reflect the value of a business. By comparing earnings per share (EPS) and share price changes over time, we can get a feel for how investor attitudes to a company have morphed over time.
During the three years of share price growth, Regal Rexnord actually saw its earnings per share (EPS) drop 7.1% per year.
This means it's unlikely the market is judging the company based on earnings growth. Therefore, we think it's worth considering other metrics as well.
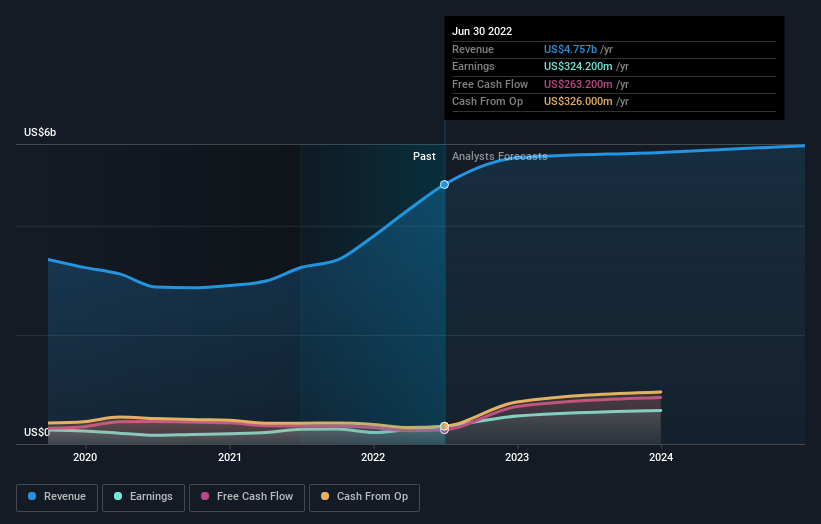
The modest 1.0% dividend yield is unlikely to be propping up the share price. It could be that the revenue growth of 10% per year is viewed as evidence that Regal Rexnord is growing. If the company is being managed for the long term good, today's shareholders might be right to hold on.
You can see how earnings and revenue have changed over time in the image below (click on the chart to see the exact values).
You can see how its balance sheet has strengthened (or weakened) over time in this free interactive graphic.
What About Dividends?
When looking at investment returns, it is important to consider the difference between total shareholder return (TSR) and share price return. The TSR incorporates the value of any spin-offs or discounted capital raisings, along with any dividends, based on the assumption that the dividends are reinvested. So for companies that pay a generous dividend, the TSR is often a lot higher than the share price return. As it happens, Regal Rexnord's TSR for the last 3 years was 105%, which exceeds the share price return mentioned earlier. And there's no prize for guessing that the dividend payments largely explain the divergence!
A Different Perspective
While it's certainly disappointing to see that Regal Rexnord shares lost 2.1% throughout the year, that wasn't as bad as the market loss of 12%. Longer term investors wouldn't be so upset, since they would have made 14%, each year, over five years. In the best case scenario the last year is just a temporary blip on the journey to a brighter future. It's always interesting to track share price performance over the longer term. But to understand Regal Rexnord better, we need to consider many other factors. For example, we've discovered 1 warning sign for Regal Rexnord that you should be aware of before investing here.
But note: Regal Rexnord may not be the best stock to buy. So take a peek at this free list of interesting companies with past earnings growth (and further growth forecast).
Please note, the market returns quoted in this article reflect the market weighted average returns of stocks that currently trade on US exchanges.
Have feedback on this article? Concerned about the content? Get in touch with us directly. Alternatively, email editorial-team (at) simplywallst.com.
This article by Simply Wall St is general in nature. We provide commentary based on historical data and analyst forecasts only using an unbiased methodology and our articles are not intended to be financial advice. It does not constitute a recommendation to buy or sell any stock, and does not take account of your objectives, or your financial situation. We aim to bring you long-term focused analysis driven by fundamental data. Note that our analysis may not factor in the latest price-sensitive company announcements or qualitative material. Simply Wall St has no position in any stocks mentioned.
Join A Paid User Research Session
You’ll receive a US$30 Amazon Gift card for 1 hour of your time while helping us build better investing tools for the individual investors like yourself. Sign up here
