
 Yahoo Finance
 Those who invested in Stabilus (ETR:STM) five years ago are up 42%
Stock pickers are generally looking for stocks that will outperform the broader market. Buying under-rated businesses is one path to excess returns. To wit, the Stabilus share price has climbed 28% in five years, easily topping the market return of 4.2% (ignoring dividends).
So let's assess the underlying fundamentals over the last 5 years and see if they've moved in lock-step with shareholder returns.
View our latest analysis for Stabilus
While markets are a powerful pricing mechanism, share prices reflect investor sentiment, not just underlying business performance. One imperfect but simple way to consider how the market perception of a company has shifted is to compare the change in the earnings per share (EPS) with the share price movement.
Stabilus' earnings per share are down 0.6% per year, despite strong share price performance over five years.
By glancing at these numbers, we'd posit that the decline in earnings per share is not representative of how the business has changed over the years. Therefore, it's worth taking a look at other metrics to try to understand the share price movements.
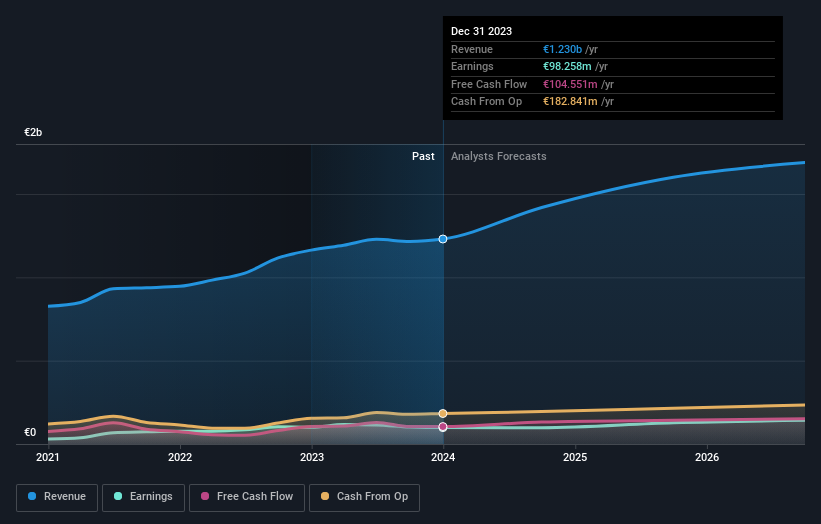
On the other hand, Stabilus' revenue is growing nicely, at a compound rate of 6.7% over the last five years. In that case, the company may be sacrificing current earnings per share to drive growth.
The graphic below depicts how earnings and revenue have changed over time (unveil the exact values by clicking on the image).
We know that Stabilus has improved its bottom line over the last three years, but what does the future have in store? It might be well worthwhile taking a look at our free report on how its financial position has changed over time.
What About Dividends?
As well as measuring the share price return, investors should also consider the total shareholder return (TSR). The TSR incorporates the value of any spin-offs or discounted capital raisings, along with any dividends, based on the assumption that the dividends are reinvested. Arguably, the TSR gives a more comprehensive picture of the return generated by a stock. In the case of Stabilus, it has a TSR of 42% for the last 5 years. That exceeds its share price return that we previously mentioned. This is largely a result of its dividend payments!
A Different Perspective
Stabilus shareholders are down 6.4% for the year (even including dividends), but the market itself is up 9.5%. However, keep in mind that even the best stocks will sometimes underperform the market over a twelve month period. On the bright side, long term shareholders have made money, with a gain of 7% per year over half a decade. It could be that the recent sell-off is an opportunity, so it may be worth checking the fundamental data for signs of a long term growth trend. While it is well worth considering the different impacts that market conditions can have on the share price, there are other factors that are even more important. Even so, be aware that Stabilus is showing 1 warning sign in our investment analysis , you should know about...
We will like Stabilus better if we see some big insider buys. While we wait, check out this free list of growing companies with considerable, recent, insider buying.
Please note, the market returns quoted in this article reflect the market weighted average returns of stocks that currently trade on German exchanges.
Have feedback on this article? Concerned about the content? Get in touch with us directly. Alternatively, email editorial-team (at) simplywallst.com.
This article by Simply Wall St is general in nature. We provide commentary based on historical data and analyst forecasts only using an unbiased methodology and our articles are not intended to be financial advice. It does not constitute a recommendation to buy or sell any stock, and does not take account of your objectives, or your financial situation. We aim to bring you long-term focused analysis driven by fundamental data. Note that our analysis may not factor in the latest price-sensitive company announcements or qualitative material. Simply Wall St has no position in any stocks mentioned.
