
 Yahoo Finance
 Those who invested in Standard Chartered (LON:STAN) a year ago are up 31%
The simplest way to invest in stocks is to buy exchange traded funds. But investors can boost returns by picking market-beating companies to own shares in. To wit, the Standard Chartered PLC (LON:STAN) share price is 29% higher than it was a year ago, much better than the market decline of around 9.0% (not including dividends) in the same period. If it can keep that out-performance up over the long term, investors will do very well! Unfortunately the longer term returns are not so good, with the stock falling 17% in the last three years.
So let's investigate and see if the longer term performance of the company has been in line with the underlying business' progress.
View our latest analysis for Standard Chartered
While markets are a powerful pricing mechanism, share prices reflect investor sentiment, not just underlying business performance. One way to examine how market sentiment has changed over time is to look at the interaction between a company's share price and its earnings per share (EPS).
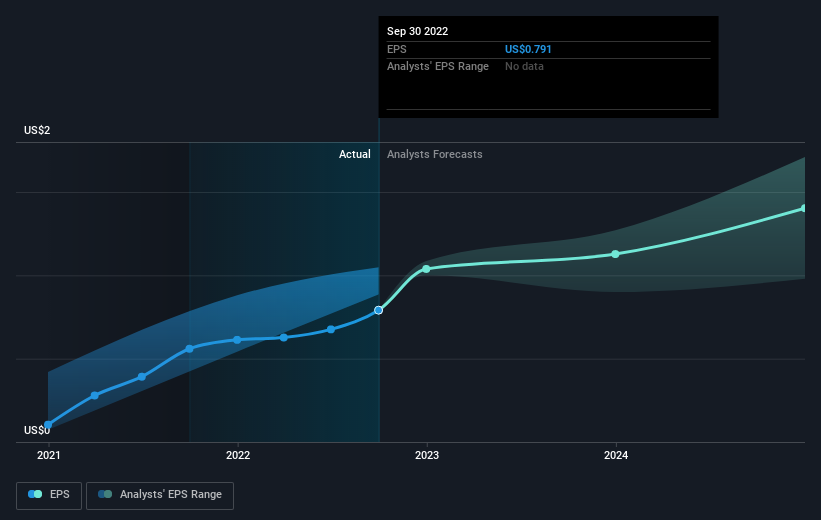
Standard Chartered was able to grow EPS by 41% in the last twelve months. It's fair to say that the share price gain of 29% did not keep pace with the EPS growth. Therefore, it seems the market isn't as excited about Standard Chartered as it was before. This could be an opportunity. This cautious sentiment is reflected in its (fairly low) P/E ratio of 8.47.
The graphic below depicts how EPS has changed over time (unveil the exact values by clicking on the image).
We consider it positive that insiders have made significant purchases in the last year. Even so, future earnings will be far more important to whether current shareholders make money. This free interactive report on Standard Chartered's earnings, revenue and cash flow is a great place to start, if you want to investigate the stock further.
What About Dividends?
As well as measuring the share price return, investors should also consider the total shareholder return (TSR). The TSR is a return calculation that accounts for the value of cash dividends (assuming that any dividend received was reinvested) and the calculated value of any discounted capital raisings and spin-offs. Arguably, the TSR gives a more comprehensive picture of the return generated by a stock. We note that for Standard Chartered the TSR over the last 1 year was 31%, which is better than the share price return mentioned above. This is largely a result of its dividend payments!
A Different Perspective
We're pleased to report that Standard Chartered shareholders have received a total shareholder return of 31% over one year. Of course, that includes the dividend. That certainly beats the loss of about 3% per year over the last half decade. The long term loss makes us cautious, but the short term TSR gain certainly hints at a brighter future. If you want to research this stock further, the data on insider buying is an obvious place to start. You can click here to see who has been buying shares - and the price they paid.
Standard Chartered is not the only stock insiders are buying. So take a peek at this free list of growing companies with insider buying.
Please note, the market returns quoted in this article reflect the market weighted average returns of stocks that currently trade on GB exchanges.
Have feedback on this article? Concerned about the content? Get in touch with us directly. Alternatively, email editorial-team (at) simplywallst.com.
This article by Simply Wall St is general in nature. We provide commentary based on historical data and analyst forecasts only using an unbiased methodology and our articles are not intended to be financial advice. It does not constitute a recommendation to buy or sell any stock, and does not take account of your objectives, or your financial situation. We aim to bring you long-term focused analysis driven by fundamental data. Note that our analysis may not factor in the latest price-sensitive company announcements or qualitative material. Simply Wall St has no position in any stocks mentioned.
Join A Paid User Research Session
You’ll receive a US$30 Amazon Gift card for 1 hour of your time while helping us build better investing tools for the individual investors like yourself. Sign up here
