
 Yahoo Finance
 Those who invested in Ta Ann Holdings Berhad (KLSE:TAANN) five years ago are up 152%
Stock pickers are generally looking for stocks that will outperform the broader market. Buying under-rated businesses is one path to excess returns. To wit, the Ta Ann Holdings Berhad share price has climbed 80% in five years, easily topping the market decline of 1.4% (ignoring dividends). On the other hand, the more recent gains haven't been so impressive, with shareholders gaining just 35% , including dividends .
So let's assess the underlying fundamentals over the last 5 years and see if they've moved in lock-step with shareholder returns.
See our latest analysis for Ta Ann Holdings Berhad
There is no denying that markets are sometimes efficient, but prices do not always reflect underlying business performance. One flawed but reasonable way to assess how sentiment around a company has changed is to compare the earnings per share (EPS) with the share price.
During five years of share price growth, Ta Ann Holdings Berhad achieved compound earnings per share (EPS) growth of 16% per year. This EPS growth is higher than the 13% average annual increase in the share price. So one could conclude that the broader market has become more cautious towards the stock. This cautious sentiment is reflected in its (fairly low) P/E ratio of 11.18.
The graphic below depicts how EPS has changed over time (unveil the exact values by clicking on the image).
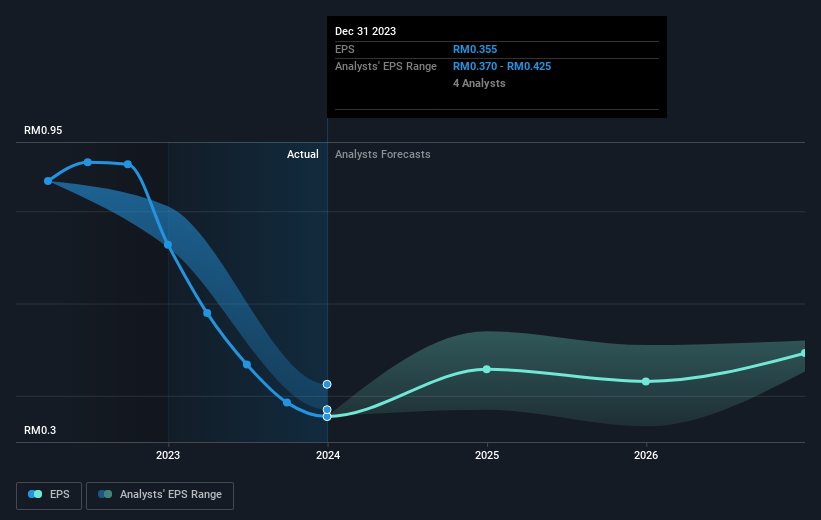
We know that Ta Ann Holdings Berhad has improved its bottom line over the last three years, but what does the future have in store? This free interactive report on Ta Ann Holdings Berhad's balance sheet strength is a great place to start, if you want to investigate the stock further.
What About Dividends?
As well as measuring the share price return, investors should also consider the total shareholder return (TSR). Whereas the share price return only reflects the change in the share price, the TSR includes the value of dividends (assuming they were reinvested) and the benefit of any discounted capital raising or spin-off. It's fair to say that the TSR gives a more complete picture for stocks that pay a dividend. We note that for Ta Ann Holdings Berhad the TSR over the last 5 years was 152%, which is better than the share price return mentioned above. The dividends paid by the company have thusly boosted the total shareholder return.
A Different Perspective
We're pleased to report that Ta Ann Holdings Berhad shareholders have received a total shareholder return of 35% over one year. And that does include the dividend. That's better than the annualised return of 20% over half a decade, implying that the company is doing better recently. Someone with an optimistic perspective could view the recent improvement in TSR as indicating that the business itself is getting better with time. It's always interesting to track share price performance over the longer term. But to understand Ta Ann Holdings Berhad better, we need to consider many other factors. Case in point: We've spotted 2 warning signs for Ta Ann Holdings Berhad you should be aware of.
But note: Ta Ann Holdings Berhad may not be the best stock to buy. So take a peek at this free list of interesting companies with past earnings growth (and further growth forecast).
Please note, the market returns quoted in this article reflect the market weighted average returns of stocks that currently trade on Malaysian exchanges.
Have feedback on this article? Concerned about the content? Get in touch with us directly. Alternatively, email editorial-team (at) simplywallst.com.
This article by Simply Wall St is general in nature. We provide commentary based on historical data and analyst forecasts only using an unbiased methodology and our articles are not intended to be financial advice. It does not constitute a recommendation to buy or sell any stock, and does not take account of your objectives, or your financial situation. We aim to bring you long-term focused analysis driven by fundamental data. Note that our analysis may not factor in the latest price-sensitive company announcements or qualitative material. Simply Wall St has no position in any stocks mentioned.
