
 Yahoo Finance
 Those who invested in UGI (NYSE:UGI) five years ago are up 1.1%
In order to justify the effort of selecting individual stocks, it's worth striving to beat the returns from a market index fund. But the main game is to find enough winners to more than offset the losers So we wouldn't blame long term UGI Corporation (NYSE:UGI) shareholders for doubting their decision to hold, with the stock down 13% over a half decade.
Now let's have a look at the company's fundamentals, and see if the long term shareholder return has matched the performance of the underlying business.
See our latest analysis for UGI
There is no denying that markets are sometimes efficient, but prices do not always reflect underlying business performance. One flawed but reasonable way to assess how sentiment around a company has changed is to compare the earnings per share (EPS) with the share price.
During the five years over which the share price declined, UGI's earnings per share (EPS) dropped by 21% each year. The share price decline of 3% per year isn't as bad as the EPS decline. So investors might expect EPS to bounce back -- or they may have previously foreseen the EPS decline.
The graphic below depicts how EPS has changed over time (unveil the exact values by clicking on the image).
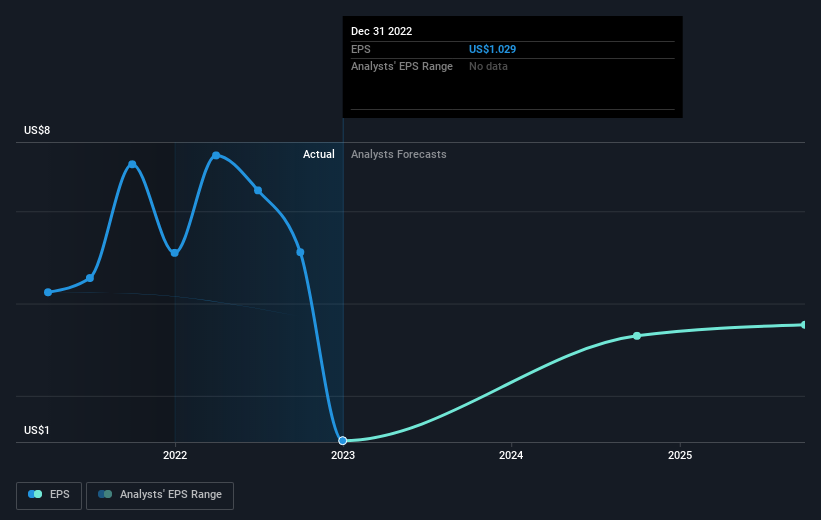
Dive deeper into UGI's key metrics by checking this interactive graph of UGI's earnings, revenue and cash flow.
What About Dividends?
When looking at investment returns, it is important to consider the difference between total shareholder return (TSR) and share price return. The TSR incorporates the value of any spin-offs or discounted capital raisings, along with any dividends, based on the assumption that the dividends are reinvested. Arguably, the TSR gives a more comprehensive picture of the return generated by a stock. As it happens, UGI's TSR for the last 5 years was 1.1%, which exceeds the share price return mentioned earlier. And there's no prize for guessing that the dividend payments largely explain the divergence!
A Different Perspective
It's good to see that UGI has rewarded shareholders with a total shareholder return of 7.5% in the last twelve months. And that does include the dividend. That gain is better than the annual TSR over five years, which is 0.2%. Therefore it seems like sentiment around the company has been positive lately. Someone with an optimistic perspective could view the recent improvement in TSR as indicating that the business itself is getting better with time. While it is well worth considering the different impacts that market conditions can have on the share price, there are other factors that are even more important. For instance, we've identified 4 warning signs for UGI (2 make us uncomfortable) that you should be aware of.
Of course UGI may not be the best stock to buy. So you may wish to see this free collection of growth stocks.
Please note, the market returns quoted in this article reflect the market weighted average returns of stocks that currently trade on US exchanges.
Have feedback on this article? Concerned about the content? Get in touch with us directly. Alternatively, email editorial-team (at) simplywallst.com.
This article by Simply Wall St is general in nature. We provide commentary based on historical data and analyst forecasts only using an unbiased methodology and our articles are not intended to be financial advice. It does not constitute a recommendation to buy or sell any stock, and does not take account of your objectives, or your financial situation. We aim to bring you long-term focused analysis driven by fundamental data. Note that our analysis may not factor in the latest price-sensitive company announcements or qualitative material. Simply Wall St has no position in any stocks mentioned.
Join A Paid User Research Session
You’ll receive a US$30 Amazon Gift card for 1 hour of your time while helping us build better investing tools for the individual investors like yourself. Sign up here
