
 Yahoo Finance
 Those who invested in Weir Group (LON:WEIR) three years ago are up 33%
One simple way to benefit from the stock market is to buy an index fund. But if you choose individual stocks with prowess, you can make superior returns. Just take a look at The Weir Group PLC (LON:WEIR), which is up 29%, over three years, soundly beating the market decline of 1.3% (not including dividends).
So let's investigate and see if the longer term performance of the company has been in line with the underlying business' progress.
See our latest analysis for Weir Group
In his essay The Superinvestors of Graham-and-Doddsville Warren Buffett described how share prices do not always rationally reflect the value of a business. One way to examine how market sentiment has changed over time is to look at the interaction between a company's share price and its earnings per share (EPS).
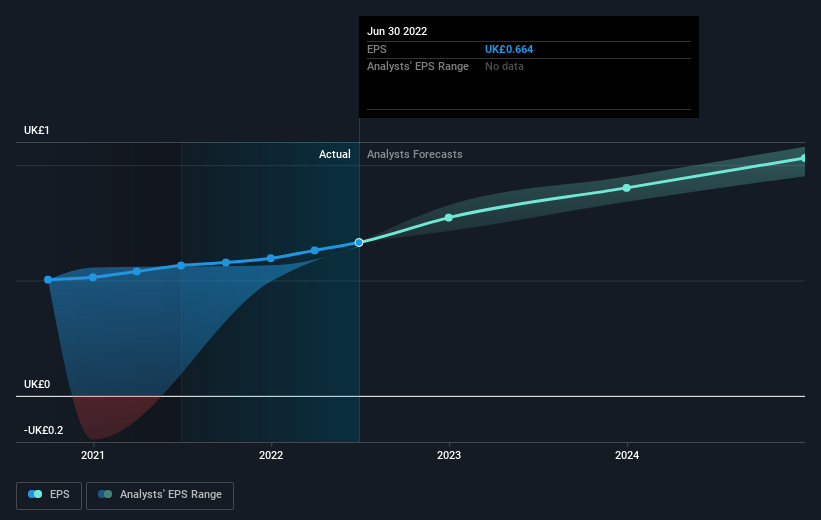
Weir Group was able to grow its EPS at 37% per year over three years, sending the share price higher. The average annual share price increase of 9% is actually lower than the EPS growth. Therefore, it seems the market has moderated its expectations for growth, somewhat.
The graphic below depicts how EPS has changed over time (unveil the exact values by clicking on the image).
We know that Weir Group has improved its bottom line over the last three years, but what does the future have in store? Take a more thorough look at Weir Group's financial health with this free report on its balance sheet.
What About Dividends?
When looking at investment returns, it is important to consider the difference between total shareholder return (TSR) and share price return. The TSR incorporates the value of any spin-offs or discounted capital raisings, along with any dividends, based on the assumption that the dividends are reinvested. So for companies that pay a generous dividend, the TSR is often a lot higher than the share price return. We note that for Weir Group the TSR over the last 3 years was 33%, which is better than the share price return mentioned above. This is largely a result of its dividend payments!
A Different Perspective
While it's certainly disappointing to see that Weir Group shares lost 1.1% throughout the year, that wasn't as bad as the market loss of 3.8%. Of course, the long term returns are far more important and the good news is that over five years, the stock has returned 0.5% for each year. It could be that the business is just facing some short term problems, but shareholders should keep a close eye on the fundamentals. I find it very interesting to look at share price over the long term as a proxy for business performance. But to truly gain insight, we need to consider other information, too. Case in point: We've spotted 1 warning sign for Weir Group you should be aware of.
But note: Weir Group may not be the best stock to buy. So take a peek at this free list of interesting companies with past earnings growth (and further growth forecast).
Please note, the market returns quoted in this article reflect the market weighted average returns of stocks that currently trade on GB exchanges.
Have feedback on this article? Concerned about the content? Get in touch with us directly. Alternatively, email editorial-team (at) simplywallst.com.
This article by Simply Wall St is general in nature. We provide commentary based on historical data and analyst forecasts only using an unbiased methodology and our articles are not intended to be financial advice. It does not constitute a recommendation to buy or sell any stock, and does not take account of your objectives, or your financial situation. We aim to bring you long-term focused analysis driven by fundamental data. Note that our analysis may not factor in the latest price-sensitive company announcements or qualitative material. Simply Wall St has no position in any stocks mentioned.
Join A Paid User Research Session
You’ll receive a US$30 Amazon Gift card for 1 hour of your time while helping us build better investing tools for the individual investors like yourself. Sign up here
