
 Yahoo Finance
 Those Who Purchased Archos (EPA:JXR) Shares Five Years Ago Have A 98% Loss To Show For It

Long term investing is the way to go, but that doesn't mean you should hold every stock forever. We really hate to see fellow investors lose their hard-earned money. For example, we sympathize with anyone who was caught holding Archos S.A. (EPA:JXR) during the five years that saw its share price drop a whopping 98%. And it's not just long term holders hurting, because the stock is down 86% in the last year. Furthermore, it's down 67% in about a quarter. That's not much fun for holders.
While a drop like that is definitely a body blow, money isn't as important as health and happiness.
Check out our latest analysis for Archos
Archos isn't currently profitable, so most analysts would look to revenue growth to get an idea of how fast the underlying business is growing. Generally speaking, companies without profits are expected to grow revenue every year, and at a good clip. Some companies are willing to postpone profitability to grow revenue faster, but in that case one does expect good top-line growth.
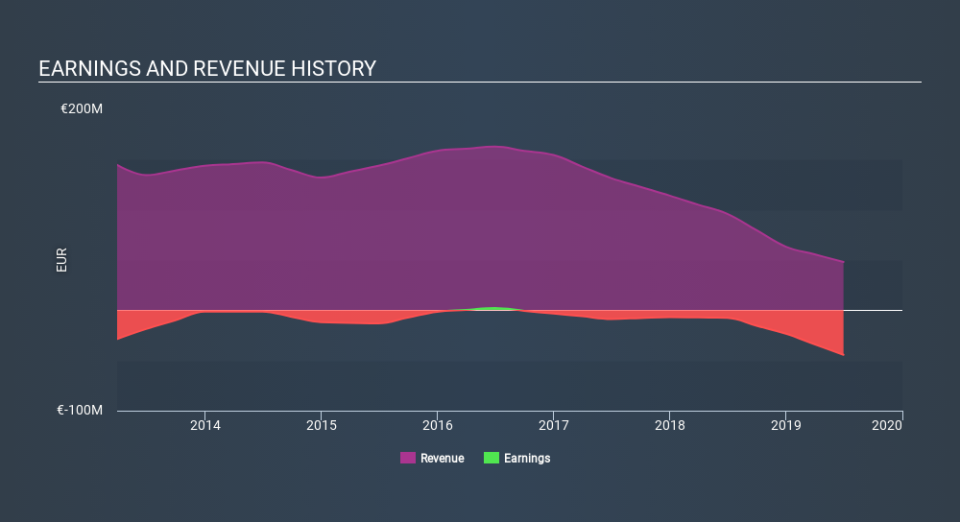
In the last five years Archos saw its revenue shrink by 15% per year. That's definitely a weaker result than most pre-profit companies report. So it's not altogether surprising to see the share price down 56% per year in the same time period. This kind of price performance makes us very wary, especially when combined with falling revenue. Ironically, that behavior could create an opportunity for the contrarian investor - but only if there are good reasons to predict a brighter future.
You can see how earnings and revenue have changed over time in the image below (click on the chart to see the exact values).
You can see how its balance sheet has strengthened (or weakened) over time in this free interactive graphic.
A Different Perspective
We regret to report that Archos shareholders are down 86% for the year. Unfortunately, that's worse than the broader market decline of 15%. However, it could simply be that the share price has been impacted by broader market jitters. It might be worth keeping an eye on the fundamentals, in case there's a good opportunity. Regrettably, last year's performance caps off a bad run, with the shareholders facing a total loss of 55% per year over five years. We realise that Baron Rothschild has said investors should "buy when there is blood on the streets", but we caution that investors should first be sure they are buying a high quality business. While it is well worth considering the different impacts that market conditions can have on the share price, there are other factors that are even more important. Even so, be aware that Archos is showing 7 warning signs in our investment analysis , and 3 of those are a bit unpleasant...
Of course Archos may not be the best stock to buy. So you may wish to see this free collection of growth stocks.
Please note, the market returns quoted in this article reflect the market weighted average returns of stocks that currently trade on FR exchanges.
If you spot an error that warrants correction, please contact the editor at editorial-team@simplywallst.com. This article by Simply Wall St is general in nature. It does not constitute a recommendation to buy or sell any stock, and does not take account of your objectives, or your financial situation. Simply Wall St has no position in the stocks mentioned.
We aim to bring you long-term focused research analysis driven by fundamental data. Note that our analysis may not factor in the latest price-sensitive company announcements or qualitative material. Thank you for reading.
