
 Yahoo Finance
 Those Who Purchased Hornby (LON:HRN) Shares Five Years Ago Have A 49% Loss To Show For It

The main aim of stock picking is to find the market-beating stocks. But in any portfolio, there will be mixed results between individual stocks. At this point some shareholders may be questioning their investment in Hornby PLC (LON:HRN), since the last five years saw the share price fall 49%. Shareholders have had an even rougher run lately, with the share price down 15% in the last 90 days.
See our latest analysis for Hornby
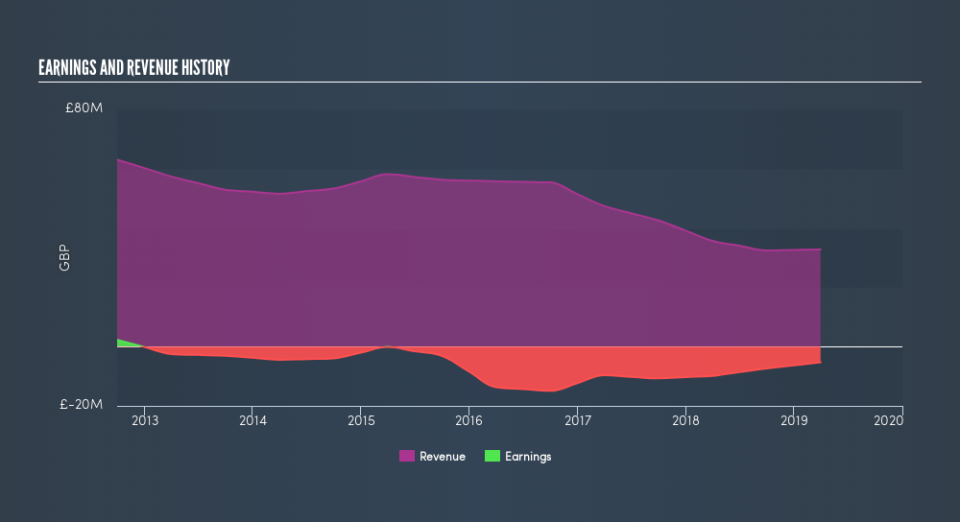
Given that Hornby didn't make a profit in the last twelve months, we'll focus on revenue growth to form a quick view of its business development. Shareholders of unprofitable companies usually expect strong revenue growth. As you can imagine, fast revenue growth, when maintained, often leads to fast profit growth.
Over half a decade Hornby reduced its trailing twelve month revenue by 11% for each year. That puts it in an unattractive cohort, to put it mildly. It seems pretty reasonable to us that the share price dipped 13% per year in that time. We doubt many shareholders are delighted with this share price performance. It is possible for businesses to bounce back but as Buffett says, 'turnarounds seldom turn'.
The graphic below depicts how earnings and revenue have changed over time (unveil the exact values by clicking on the image).
Balance sheet strength is crucial. It might be well worthwhile taking a look at our free report on how its financial position has changed over time.
A Different Perspective
While the broader market gained around 2.0% in the last year, Hornby shareholders lost 9.1%. Even the share prices of good stocks drop sometimes, but we want to see improvements in the fundamental metrics of a business, before getting too interested. However, the loss over the last year isn't as bad as the 13% per annum loss investors have suffered over the last half decade. We'd need to see some sustained improvements in the key metrics before we could muster much enthusiasm. Shareholders might want to examine this detailed historical graph of past earnings, revenue and cash flow.
Of course, you might find a fantastic investment by looking elsewhere. So take a peek at this free list of companies we expect will grow earnings.
Please note, the market returns quoted in this article reflect the market weighted average returns of stocks that currently trade on GB exchanges.
We aim to bring you long-term focused research analysis driven by fundamental data. Note that our analysis may not factor in the latest price-sensitive company announcements or qualitative material.
If you spot an error that warrants correction, please contact the editor at editorial-team@simplywallst.com. This article by Simply Wall St is general in nature. It does not constitute a recommendation to buy or sell any stock, and does not take account of your objectives, or your financial situation. Simply Wall St has no position in the stocks mentioned. Thank you for reading.
