
 Yahoo Finance
 Those Who Purchased PZ Cussons (LON:PZC) Shares Five Years Ago Have A 44% Loss To Show For It

Ideally, your overall portfolio should beat the market average. But in any portfolio, there will be mixed results between individual stocks. So we wouldn't blame long term PZ Cussons Plc (LON:PZC) shareholders for doubting their decision to hold, with the stock down 44% over a half decade.
Want to participate in a short research study? Help shape the future of investing tools and you could win a $250 gift card!
View our latest analysis for PZ Cussons
To paraphrase Benjamin Graham: Over the short term the market is a voting machine, but over the long term it's a weighing machine. By comparing earnings per share (EPS) and share price changes over time, we can get a feel for how investor attitudes to a company have morphed over time.
During the five years over which the share price declined, PZ Cussons's earnings per share (EPS) dropped by 5.9% each year. This reduction in EPS is less than the 11% annual reduction in the share price. So it seems the market was too confident about the business, in the past.
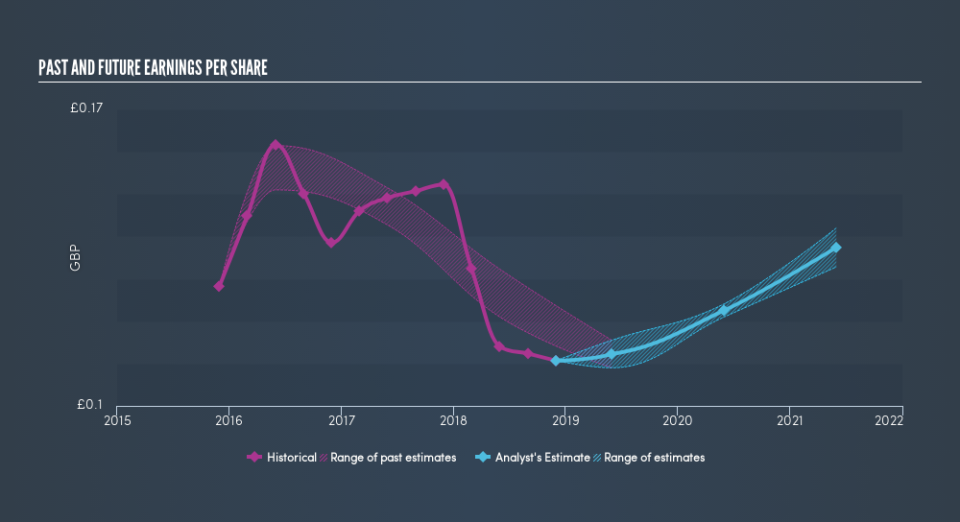
You can see below how EPS has changed over time (discover the exact values by clicking on the image).
Dive deeper into PZ Cussons's key metrics by checking this interactive graph of PZ Cussons's earnings, revenue and cash flow.
What About Dividends?
When looking at investment returns, it is important to consider the difference between total shareholder return (TSR) and share price return. Whereas the share price return only reflects the change in the share price, the TSR includes the value of dividends (assuming they were reinvested) and the benefit of any discounted capital raising or spin-off. It's fair to say that the TSR gives a more complete picture for stocks that pay a dividend. In the case of PZ Cussons, it has a TSR of -36% for the last 5 years. That exceeds its share price return that we previously mentioned. And there's no prize for guessing that the dividend payments largely explain the divergence!
A Different Perspective
We regret to report that PZ Cussons shareholders are down 16% for the year (even including dividends). Unfortunately, that's worse than the broader market decline of 0.7%. However, it could simply be that the share price has been impacted by broader market jitters. It might be worth keeping an eye on the fundamentals, in case there's a good opportunity. Regrettably, last year's performance caps off a bad run, with the shareholders facing a total loss of 8.4% per year over five years. We realise that Buffett has said investors should 'buy when there is blood on the streets', but we caution that investors should first be sure they are buying a high quality businesses. If you would like to research PZ Cussons in more detail then you might want to take a look at whether insiders have been buying or selling shares in the company.
For those who like to find winning investments this free list of growing companies with recent insider purchasing, could be just the ticket.
Please note, the market returns quoted in this article reflect the market weighted average returns of stocks that currently trade on GB exchanges.
We aim to bring you long-term focused research analysis driven by fundamental data. Note that our analysis may not factor in the latest price-sensitive company announcements or qualitative material.
If you spot an error that warrants correction, please contact the editor at editorial-team@simplywallst.com. This article by Simply Wall St is general in nature. It does not constitute a recommendation to buy or sell any stock, and does not take account of your objectives, or your financial situation. Simply Wall St has no position in the stocks mentioned. Thank you for reading.
