
 Yahoo Finance
 Those Who Purchased Record (LON:REC) Shares A Year Ago Have A 42% Loss To Show For It

It’s easy to match the overall market return by buying an index fund. But if you buy individual stocks, you can do both better or worse than that. That downside risk was realized by Record plc (LON:REC) shareholders over the last year, as the share price declined 42%. That contrasts poorly with the market return of 5.2%. On the bright side, the stock is actually up 11% in the last three years. Unfortunately the share price momentum is still quite negative, with prices down 8.5% in thirty days.
Check out our latest analysis for Record
There is no denying that markets are sometimes efficient, but prices do not always reflect underlying business performance. One flawed but reasonable way to assess how sentiment around a company has changed is to compare the earnings per share (EPS) with the share price.
Unfortunately Record reported an EPS drop of 0.6% for the last year. The share price decline of 42% is actually more than the EPS drop. This suggests the EPS fall has made some shareholders are more nervous about the business. The less favorable sentiment is reflected in its current P/E ratio of 9.32.
The image below shows how EPS has tracked over time (if you click on the image you can see greater detail).
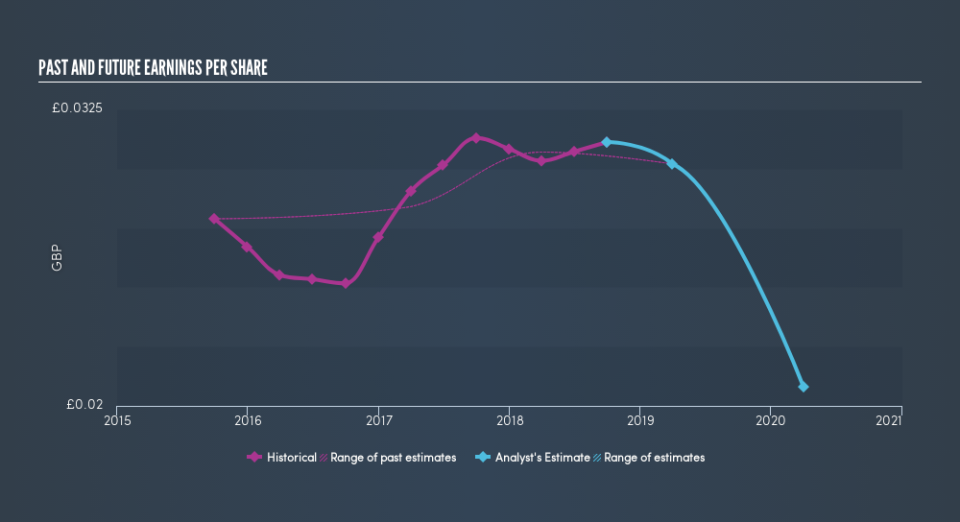
This free interactive report on Record’s earnings, revenue and cash flow is a great place to start, if you want to investigate the stock further.
What About Dividends?
It is important to consider the total shareholder return, as well as the share price return, for any given stock. Whereas the share price return only reflects the change in the share price, the TSR includes the value of dividends (assuming they were reinvested) and the benefit of any discounted capital raising. It’s fair to say that the TSR gives a more complete picture for stocks that pay a dividend. In the case of Record, it has a TSR of -37% for the last year. That exceeds its share price return that we previously mentioned. The dividends paid by the company have thusly boosted the total shareholder return.
A Different Perspective
Record shareholders are down 37% for the year (even including dividends), but the market itself is up 5.2%. However, keep in mind that even the best stocks will sometimes underperform the market over a twelve month period. Regrettably, last year’s performance caps off a bad run, with the shareholders facing a total loss of 2.2% per year over five years. We realise that Buffett has said investors should ‘buy when there is blood on the streets’, but we caution that investors should first be sure they are buying a high quality businesses. If you would like to research Record in more detail then you might want to take a look at whether insiders have been buying or selling shares in the company.
If you like to buy stocks alongside management, then you might just love this free list of companies. (Hint: insiders have been buying them).
Please note, the market returns quoted in this article reflect the market weighted average returns of stocks that currently trade on GB exchanges.
We aim to bring you long-term focused research analysis driven by fundamental data. Note that our analysis may not factor in the latest price-sensitive company announcements or qualitative material.
If you spot an error that warrants correction, please contact the editor at editorial-team@simplywallst.com. This article by Simply Wall St is general in nature. It does not constitute a recommendation to buy or sell any stock, and does not take account of your objectives, or your financial situation. Simply Wall St has no position in the stocks mentioned. Thank you for reading.
