
 Yahoo Finance
 Those Who Purchased Sampo Oyj (HEL:SAMPO) Shares A Year Ago Have A 19% Loss To Show For It

Passive investing in an index fund is a good way to ensure your own returns roughly match the overall market. But if you buy individual stocks, you can do both better or worse than that. Unfortunately the Sampo Oyj (HEL:SAMPO) share price slid 19% over twelve months. That's well bellow the market return of -0.7%. At least the damage isn't so bad if you look at the last three years, since the stock is down 14% in that time. Shareholders have had an even rougher run lately, with the share price down 17% in the last 90 days.
Check out our latest analysis for Sampo Oyj
To quote Buffett, 'Ships will sail around the world but the Flat Earth Society will flourish. There will continue to be wide discrepancies between price and value in the marketplace...' One flawed but reasonable way to assess how sentiment around a company has changed is to compare the earnings per share (EPS) with the share price.
Unhappily, Sampo Oyj had to report a 37% decline in EPS over the last year. The share price fall of 19% isn't as bad as the reduction in earnings per share. So the market may not be too worried about the EPS figure, at the moment -- or it may have expected earnings to drop faster.
The company's earnings per share (over time) is depicted in the image below (click to see the exact numbers).
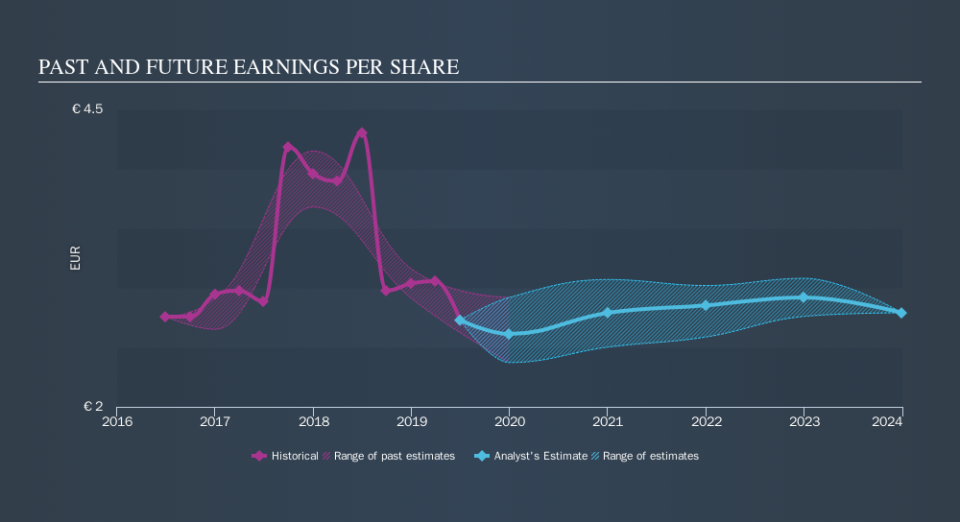
Before buying or selling a stock, we always recommend a close examination of historic growth trends, available here..
What About Dividends?
It is important to consider the total shareholder return, as well as the share price return, for any given stock. The TSR incorporates the value of any spin-offs or discounted capital raisings, along with any dividends, based on the assumption that the dividends are reinvested. So for companies that pay a generous dividend, the TSR is often a lot higher than the share price return. In the case of Sampo Oyj, it has a TSR of -11% for the last year. That exceeds its share price return that we previously mentioned. And there's no prize for guessing that the dividend payments largely explain the divergence!
A Different Perspective
While the broader market lost about 0.7% in the twelve months, Sampo Oyj shareholders did even worse, losing 11% (even including dividends) . However, it could simply be that the share price has been impacted by broader market jitters. It might be worth keeping an eye on the fundamentals, in case there's a good opportunity. Longer term investors wouldn't be so upset, since they would have made 4.5%, each year, over five years. If the fundamental data continues to indicate long term sustainable growth, the current sell-off could be an opportunity worth considering. Importantly, we haven't analysed Sampo Oyj's dividend history. This free visual report on its dividends is a must-read if you're thinking of buying.
Of course Sampo Oyj may not be the best stock to buy. So you may wish to see this free collection of growth stocks.
Please note, the market returns quoted in this article reflect the market weighted average returns of stocks that currently trade on FI exchanges.
We aim to bring you long-term focused research analysis driven by fundamental data. Note that our analysis may not factor in the latest price-sensitive company announcements or qualitative material.
If you spot an error that warrants correction, please contact the editor at editorial-team@simplywallst.com. This article by Simply Wall St is general in nature. It does not constitute a recommendation to buy or sell any stock, and does not take account of your objectives, or your financial situation. Simply Wall St has no position in the stocks mentioned. Thank you for reading.
