
 Yahoo Finance
 Those Who Purchased UOB-Kay Hian Holdings (SGX:U10) Shares Five Years Ago Have A 23% Loss To Show For It

These days it's easy to simply buy an index fund, and your returns should (roughly) match the market. But if you pick the right individual stocks, you could make more -- or less -- than that. While the UOB-Kay Hian Holdings Limited (SGX:U10) share price is down 23% over half a decade, the total return to shareholders (which includes dividends) was -9.2%. That's better than the market which declined 15% over the same time. There was little comfort for shareholders in the last week as the price declined a further 1.7%.
See our latest analysis for UOB-Kay Hian Holdings
While the efficient markets hypothesis continues to be taught by some, it has been proven that markets are over-reactive dynamic systems, and investors are not always rational. One way to examine how market sentiment has changed over time is to look at the interaction between a company's share price and its earnings per share (EPS).
Looking back five years, both UOB-Kay Hian Holdings's share price and EPS declined; the latter at a rate of 3.3% per year. This reduction in EPS is less than the 5.1% annual reduction in the share price. So it seems the market was too confident about the business, in the past.
The company's earnings per share (over time) is depicted in the image below (click to see the exact numbers).
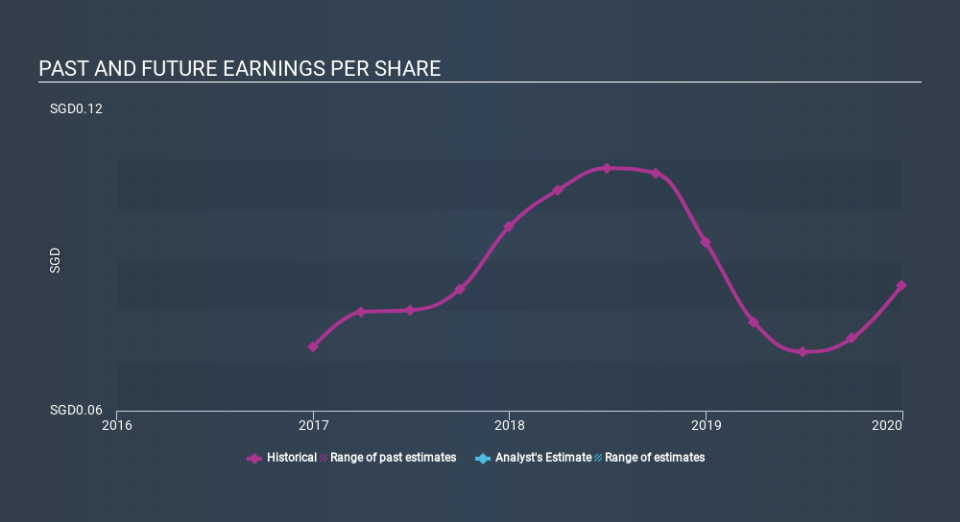
It might be well worthwhile taking a look at our free report on UOB-Kay Hian Holdings's earnings, revenue and cash flow.
What About Dividends?
It is important to consider the total shareholder return, as well as the share price return, for any given stock. The TSR is a return calculation that accounts for the value of cash dividends (assuming that any dividend received was reinvested) and the calculated value of any discounted capital raisings and spin-offs. So for companies that pay a generous dividend, the TSR is often a lot higher than the share price return. As it happens, UOB-Kay Hian Holdings's TSR for the last 5 years was -9.2%, which exceeds the share price return mentioned earlier. And there's no prize for guessing that the dividend payments largely explain the divergence!
A Different Perspective
While it's never nice to take a loss, UOB-Kay Hian Holdings shareholders can take comfort that , including dividends, their trailing twelve month loss of 0.7% wasn't as bad as the market loss of around 19%. What is more upsetting is the 1.9% per annum loss investors have suffered over the last half decade. While the losses are slowing we doubt many shareholders are happy with the stock. It's always interesting to track share price performance over the longer term. But to understand UOB-Kay Hian Holdings better, we need to consider many other factors. Case in point: We've spotted 3 warning signs for UOB-Kay Hian Holdings you should be aware of, and 2 of them make us uncomfortable.
Of course UOB-Kay Hian Holdings may not be the best stock to buy. So you may wish to see this free collection of growth stocks.
Please note, the market returns quoted in this article reflect the market weighted average returns of stocks that currently trade on SG exchanges.
If you spot an error that warrants correction, please contact the editor at editorial-team@simplywallst.com. This article by Simply Wall St is general in nature. It does not constitute a recommendation to buy or sell any stock, and does not take account of your objectives, or your financial situation. Simply Wall St has no position in the stocks mentioned.
We aim to bring you long-term focused research analysis driven by fundamental data. Note that our analysis may not factor in the latest price-sensitive company announcements or qualitative material. Thank you for reading.
