
 Yahoo Finance
 The three-year shareholder returns and company earnings persist lower as Cars.com (NYSE:CARS) stock falls a further 24% in past week
If you love investing in stocks you're bound to buy some losers. Long term Cars.com Inc. (NYSE:CARS) shareholders know that all too well, since the share price is down considerably over three years. So they might be feeling emotional about the 61% share price collapse, in that time. And over the last year the share price fell 32%, so we doubt many shareholders are delighted. Shareholders have had an even rougher run lately, with the share price down 43% in the last 90 days. This could be related to the recent financial results - you can catch up on the most recent data by reading our company report.
With the stock having lost 24% in the past week, it's worth taking a look at business performance and seeing if there's any red flags.
See our latest analysis for Cars.com
There is no denying that markets are sometimes efficient, but prices do not always reflect underlying business performance. By comparing earnings per share (EPS) and share price changes over time, we can get a feel for how investor attitudes to a company have morphed over time.
During five years of share price growth, Cars.com moved from a loss to profitability. We would usually expect to see the share price rise as a result. So given the share price is down it's worth checking some other metrics too.
With revenue flat over three years, it seems unlikely that the share price is reflecting the top line. We're not entirely sure why the share price is dropped, but it does seem likely investors have become less optimistic about the business.
You can see below how earnings and revenue have changed over time (discover the exact values by clicking on the image).
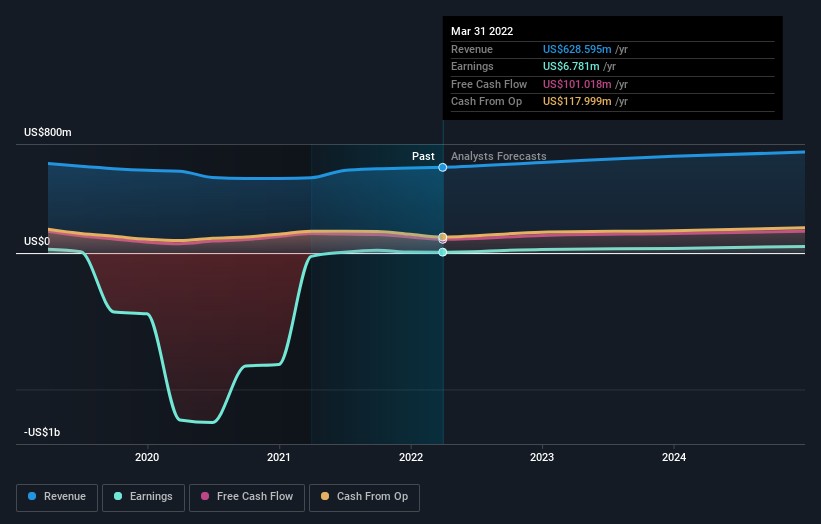
We know that Cars.com has improved its bottom line lately, but what does the future have in store? So it makes a lot of sense to check out what analysts think Cars.com will earn in the future (free profit forecasts).
A Different Perspective
The last twelve months weren't great for Cars.com shares, which performed worse than the market, costing holders 32%. Meanwhile, the broader market slid about 9.4%, likely weighing on the stock. The three-year loss of 17% per year isn't as bad as the last twelve months, suggesting that the company has not been able to convince the market it has solved its problems. We would be wary of buying into a company with unsolved problems, although some investors will buy into struggling stocks if they believe the price is sufficiently attractive. While it is well worth considering the different impacts that market conditions can have on the share price, there are other factors that are even more important. Case in point: We've spotted 4 warning signs for Cars.com you should be aware of, and 1 of them is potentially serious.
For those who like to find winning investments this free list of growing companies with recent insider purchasing, could be just the ticket.
Please note, the market returns quoted in this article reflect the market weighted average returns of stocks that currently trade on US exchanges.
Have feedback on this article? Concerned about the content? Get in touch with us directly. Alternatively, email editorial-team (at) simplywallst.com.
This article by Simply Wall St is general in nature. We provide commentary based on historical data and analyst forecasts only using an unbiased methodology and our articles are not intended to be financial advice. It does not constitute a recommendation to buy or sell any stock, and does not take account of your objectives, or your financial situation. We aim to bring you long-term focused analysis driven by fundamental data. Note that our analysis may not factor in the latest price-sensitive company announcements or qualitative material. Simply Wall St has no position in any stocks mentioned.
