
 Yahoo Finance
 Three Things You Should Check Before Buying Informa plc (LON:INF) For Its Dividend

Today we'll take a closer look at Informa plc (LON:INF) from a dividend investor's perspective. Owning a strong business and reinvesting the dividends is widely seen as an attractive way of growing your wealth. If you are hoping to live on the income from dividends, it's important to be a lot more stringent with your investments than the average punter.
A slim 2.7% yield is hard to get excited about, but the long payment history is respectable. At the right price, or with strong growth opportunities, Informa could have potential. Some simple research can reduce the risk of buying Informa for its dividend - read on to learn more.
Explore this interactive chart for our latest analysis on Informa!
Payout ratios
Dividends are usually paid out of company earnings. If a company is paying more than it earns, then the dividend might become unsustainable - hardly an ideal situation. Comparing dividend payments to a company's net profit after tax is a simple way of reality-checking whether a dividend is sustainable. Informa paid out 93% of its profit as dividends, over the trailing twelve month period. Its payout ratio is quite high, and the dividend is not well covered by earnings. If earnings are growing or the company has a large cash balance, this might be sustainable - still, we think it is a concern.
We also measure dividends paid against a company's levered free cash flow, to see if enough cash was generated to cover the dividend. Informa paid out a conservative 48% of its free cash flow as dividends last year. It's good to see that while Informa's dividends were not well covered by profits, at least they are affordable from a free cash flow perspective. Even so, if the company were to continue paying out almost all of its profits, we'd be concerned about whether the dividend is sustainable in a downturn.
Is Informa's Balance Sheet Risky?
As Informa's dividend was not well covered by earnings, we need to check its balance sheet for signs of financial distress. A rough way to check this is with these two simple ratios: a) net debt divided by EBITDA (earnings before interest, tax, depreciation and amortisation), and b) net interest cover. Net debt to EBITDA is a measure of a company's total debt. Net interest cover measures the ability to meet interest payments. Essentially we check that a) the company does not have too much debt, and b) that it can afford to pay the interest. With net debt of 2.80 times its EBITDA, Informa has a noticeable amount of debt, although if business stays steady, this may not be overly concerning.
Net interest cover can be calculated by dividing earnings before interest and tax (EBIT) by the company's net interest expense. Net interest cover of 5.24 times its interest expense appears reasonable for Informa, although we're conscious that even high interest cover doesn't make a company bulletproof.
Remember, you can always get a snapshot of Informa's latest financial position, by checking our visualisation of its financial health.
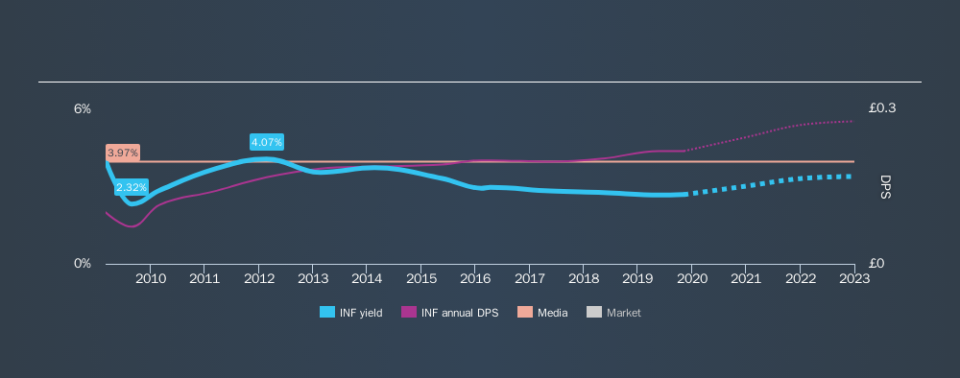
Dividend Volatility
One of the major risks of relying on dividend income, is the potential for a company to struggle financially and cut its dividend. Not only is your income cut, but the value of your investment declines as well - nasty. Informa has been paying dividends for a long time, but for the purpose of this analysis, we only examine the past 10 years of payments. This dividend has been unstable, which we define as having fallen by at least 20% one or more times over this time. During the past ten-year period, the first annual payment was UK£0.10 in 2009, compared to UK£0.22 last year. This works out to be a compound annual growth rate (CAGR) of approximately 8.2% a year over that time. The dividends haven't grown at precisely 8.2% every year, but this is a useful way to average out the historical rate of growth.
It's good to see the dividend growing at a decent rate, but the dividend has been cut at least once in the past. Informa might have put its house in order since then, but we remain cautious.
Dividend Growth Potential
Given that the dividend has been cut in the past, we need to check if earnings are growing and if that might lead to stronger dividends in the future. Earnings have grown at around 7.2% a year for the past five years, which is better than seeing them shrink! Although per-share earnings are growing at a credible rate, virtually all of the income is being paid out as dividends to shareholders. This is okay, but may limit growth in the company's future dividend payments.
Conclusion
Dividend investors should always want to know if a) a company's dividends are affordable, b) if there is a track record of consistent payments, and c) if the dividend is capable of growing. We're not keen on the fact that Informa paid out such a high percentage of its income, although its cashflow is in better shape. Unfortunately, earnings growth has also been mediocre, and the company has cut its dividend at least once in the past. While we're not hugely bearish on it, overall we think there are potentially better dividend stocks than Informa out there.
Earnings growth generally bodes well for the future value of company dividend payments. See if the 18 Informa analysts we track are forecasting continued growth with our free report on analyst estimates for the company.
If you are a dividend investor, you might also want to look at our curated list of dividend stocks yielding above 3%.
We aim to bring you long-term focused research analysis driven by fundamental data. Note that our analysis may not factor in the latest price-sensitive company announcements or qualitative material.
If you spot an error that warrants correction, please contact the editor at editorial-team@simplywallst.com. This article by Simply Wall St is general in nature. It does not constitute a recommendation to buy or sell any stock, and does not take account of your objectives, or your financial situation. Simply Wall St has no position in the stocks mentioned. Thank you for reading.
