
 Yahoo Finance
 The three-year underlying earnings growth at Barnes Group (NYSE:B) is promising, but the shareholders are still in the red over that time
For many investors, the main point of stock picking is to generate higher returns than the overall market. But the risk of stock picking is that you will likely buy under-performing companies. Unfortunately, that's been the case for longer term Barnes Group Inc. (NYSE:B) shareholders, since the share price is down 40% in the last three years, falling well short of the market return of around 60%. The falls have accelerated recently, with the share price down 17% in the last three months.
Since Barnes Group has shed US$88m from its value in the past 7 days, let's see if the longer term decline has been driven by the business' economics.
See our latest analysis for Barnes Group
In his essay The Superinvestors of Graham-and-Doddsville Warren Buffett described how share prices do not always rationally reflect the value of a business. By comparing earnings per share (EPS) and share price changes over time, we can get a feel for how investor attitudes to a company have morphed over time.
During the unfortunate three years of share price decline, Barnes Group actually saw its earnings per share (EPS) improve by 7.9% per year. This is quite a puzzle, and suggests there might be something temporarily buoying the share price. Or else the company was over-hyped in the past, and so its growth has disappointed.
It's worth taking a look at other metrics, because the EPS growth doesn't seem to match with the falling share price.
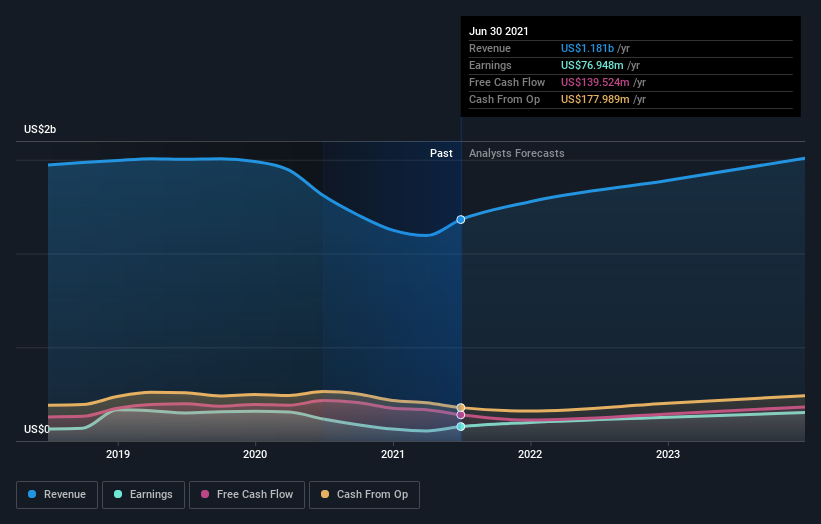
With a rather small yield of just 1.5% we doubt that the stock's share price is based on its dividend. We think that the revenue decline over three years, at a rate of 10% per year, probably had some shareholders looking to sell. After all, if revenue keeps shrinking, it may be difficult to find earnings growth in the future.
You can see below how earnings and revenue have changed over time (discover the exact values by clicking on the image).
Take a more thorough look at Barnes Group's financial health with this free report on its balance sheet.
What About Dividends?
When looking at investment returns, it is important to consider the difference between total shareholder return (TSR) and share price return. Whereas the share price return only reflects the change in the share price, the TSR includes the value of dividends (assuming they were reinvested) and the benefit of any discounted capital raising or spin-off. It's fair to say that the TSR gives a more complete picture for stocks that pay a dividend. We note that for Barnes Group the TSR over the last 3 years was -37%, which is better than the share price return mentioned above. And there's no prize for guessing that the dividend payments largely explain the divergence!
A Different Perspective
Barnes Group shareholders gained a total return of 15% during the year. But that was short of the market average. The silver lining is that the gain was actually better than the average annual return of 3% per year over five year. This could indicate that the company is winning over new investors, as it pursues its strategy. It's always interesting to track share price performance over the longer term. But to understand Barnes Group better, we need to consider many other factors. For instance, we've identified 2 warning signs for Barnes Group that you should be aware of.
We will like Barnes Group better if we see some big insider buys. While we wait, check out this free list of growing companies with considerable, recent, insider buying.
Please note, the market returns quoted in this article reflect the market weighted average returns of stocks that currently trade on US exchanges.
This article by Simply Wall St is general in nature. We provide commentary based on historical data and analyst forecasts only using an unbiased methodology and our articles are not intended to be financial advice. It does not constitute a recommendation to buy or sell any stock, and does not take account of your objectives, or your financial situation. We aim to bring you long-term focused analysis driven by fundamental data. Note that our analysis may not factor in the latest price-sensitive company announcements or qualitative material. Simply Wall St has no position in any stocks mentioned.
Have feedback on this article? Concerned about the content? Get in touch with us directly. Alternatively, email editorial-team (at) simplywallst.com.
