
 Yahoo Finance
 The three-year underlying earnings growth at KION GROUP (ETR:KGX) is promising, but the shareholders are still in the red over that time
While it may not be enough for some shareholders, we think it is good to see the KION GROUP AG (ETR:KGX) share price up 16% in a single quarter. But that doesn't help the fact that the three year return is less impressive. Truth be told the share price declined 46% in three years and that return, Dear Reader, falls short of what you could have got from passive investing with an index fund.
With the stock having lost 3.4% in the past week, it's worth taking a look at business performance and seeing if there's any red flags.
Check out our latest analysis for KION GROUP
In his essay The Superinvestors of Graham-and-Doddsville Warren Buffett described how share prices do not always rationally reflect the value of a business. By comparing earnings per share (EPS) and share price changes over time, we can get a feel for how investor attitudes to a company have morphed over time.
During the unfortunate three years of share price decline, KION GROUP actually saw its earnings per share (EPS) improve by 8.8% per year. This is quite a puzzle, and suggests there might be something temporarily buoying the share price. Or else the company was over-hyped in the past, and so its growth has disappointed.
It's worth taking a look at other metrics, because the EPS growth doesn't seem to match with the falling share price.
With a rather small yield of just 1.5% we doubt that the stock's share price is based on its dividend. We note that, in three years, revenue has actually grown at a 9.4% annual rate, so that doesn't seem to be a reason to sell shares. It's probably worth investigating KION GROUP further; while we may be missing something on this analysis, there might also be an opportunity.
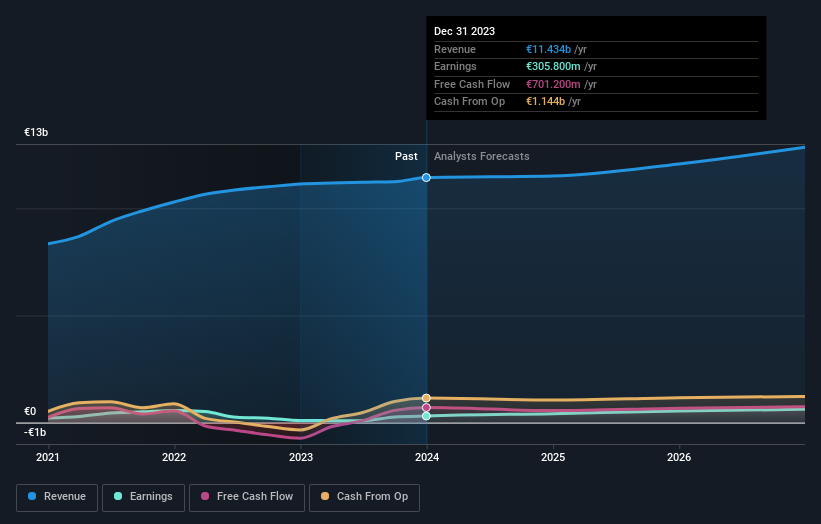
The image below shows how earnings and revenue have tracked over time (if you click on the image you can see greater detail).
KION GROUP is well known by investors, and plenty of clever analysts have tried to predict the future profit levels. So we recommend checking out this free report showing consensus forecasts
What About Dividends?
As well as measuring the share price return, investors should also consider the total shareholder return (TSR). The TSR is a return calculation that accounts for the value of cash dividends (assuming that any dividend received was reinvested) and the calculated value of any discounted capital raisings and spin-offs. So for companies that pay a generous dividend, the TSR is often a lot higher than the share price return. In the case of KION GROUP, it has a TSR of -43% for the last 3 years. That exceeds its share price return that we previously mentioned. This is largely a result of its dividend payments!
A Different Perspective
It's good to see that KION GROUP has rewarded shareholders with a total shareholder return of 31% in the last twelve months. That's including the dividend. Notably the five-year annualised TSR loss of 3% per year compares very unfavourably with the recent share price performance. The long term loss makes us cautious, but the short term TSR gain certainly hints at a brighter future. It's always interesting to track share price performance over the longer term. But to understand KION GROUP better, we need to consider many other factors. Consider for instance, the ever-present spectre of investment risk. We've identified 1 warning sign with KION GROUP , and understanding them should be part of your investment process.
We will like KION GROUP better if we see some big insider buys. While we wait, check out this free list of growing companies with considerable, recent, insider buying.
Please note, the market returns quoted in this article reflect the market weighted average returns of stocks that currently trade on German exchanges.
Have feedback on this article? Concerned about the content? Get in touch with us directly. Alternatively, email editorial-team (at) simplywallst.com.
This article by Simply Wall St is general in nature. We provide commentary based on historical data and analyst forecasts only using an unbiased methodology and our articles are not intended to be financial advice. It does not constitute a recommendation to buy or sell any stock, and does not take account of your objectives, or your financial situation. We aim to bring you long-term focused analysis driven by fundamental data. Note that our analysis may not factor in the latest price-sensitive company announcements or qualitative material. Simply Wall St has no position in any stocks mentioned.
