
 Yahoo Finance
 The three-year underlying earnings growth at La-Z-Boy (NYSE:LZB) is promising, but the shareholders are still in the red over that time
For many investors, the main point of stock picking is to generate higher returns than the overall market. But in any portfolio, there are likely to be some stocks that fall short of that benchmark. We regret to report that long term La-Z-Boy Incorporated (NYSE:LZB) shareholders have had that experience, with the share price dropping 22% in three years, versus a market return of about 16%. More recently, the share price has dropped a further 10% in a month.
Since La-Z-Boy has shed US$148m from its value in the past 7 days, let's see if the longer term decline has been driven by the business' economics.
See our latest analysis for La-Z-Boy
There is no denying that markets are sometimes efficient, but prices do not always reflect underlying business performance. One way to examine how market sentiment has changed over time is to look at the interaction between a company's share price and its earnings per share (EPS).
Although the share price is down over three years, La-Z-Boy actually managed to grow EPS by 21% per year in that time. This is quite a puzzle, and suggests there might be something temporarily buoying the share price. Alternatively, growth expectations may have been unreasonable in the past.
It's worth taking a look at other metrics, because the EPS growth doesn't seem to match with the falling share price.
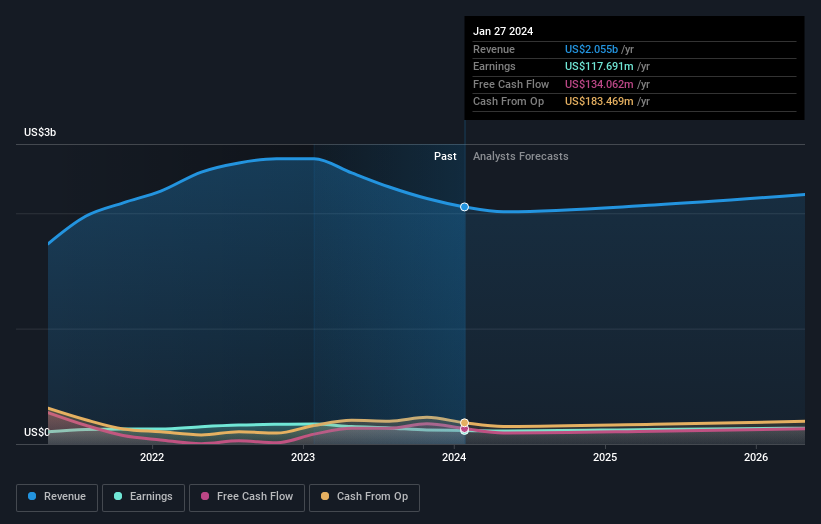
Revenue is actually up 7.4% over the three years, so the share price drop doesn't seem to hinge on revenue, either. It's probably worth investigating La-Z-Boy further; while we may be missing something on this analysis, there might also be an opportunity.
You can see below how earnings and revenue have changed over time (discover the exact values by clicking on the image).
If you are thinking of buying or selling La-Z-Boy stock, you should check out this FREE detailed report on its balance sheet.
What About Dividends?
When looking at investment returns, it is important to consider the difference between total shareholder return (TSR) and share price return. The TSR is a return calculation that accounts for the value of cash dividends (assuming that any dividend received was reinvested) and the calculated value of any discounted capital raisings and spin-offs. Arguably, the TSR gives a more comprehensive picture of the return generated by a stock. We note that for La-Z-Boy the TSR over the last 3 years was -17%, which is better than the share price return mentioned above. And there's no prize for guessing that the dividend payments largely explain the divergence!
A Different Perspective
La-Z-Boy provided a TSR of 19% over the last twelve months. But that was short of the market average. The silver lining is that the gain was actually better than the average annual return of 1.6% per year over five year. This suggests the company might be improving over time. It's always interesting to track share price performance over the longer term. But to understand La-Z-Boy better, we need to consider many other factors. Even so, be aware that La-Z-Boy is showing 1 warning sign in our investment analysis , you should know about...
If you are like me, then you will not want to miss this free list of growing companies that insiders are buying.
Please note, the market returns quoted in this article reflect the market weighted average returns of stocks that currently trade on American exchanges.
Have feedback on this article? Concerned about the content? Get in touch with us directly. Alternatively, email editorial-team (at) simplywallst.com.
This article by Simply Wall St is general in nature. We provide commentary based on historical data and analyst forecasts only using an unbiased methodology and our articles are not intended to be financial advice. It does not constitute a recommendation to buy or sell any stock, and does not take account of your objectives, or your financial situation. We aim to bring you long-term focused analysis driven by fundamental data. Note that our analysis may not factor in the latest price-sensitive company announcements or qualitative material. Simply Wall St has no position in any stocks mentioned.
