
 Yahoo Finance
 Update: Tieto Oyj (HEL:TIETO) Stock Gained 17% In The Last Five Years

Want to participate in a short research study? Help shape the future of investing tools and you could win a $250 gift card!
If you buy and hold a stock for many years, you'd hope to be making a profit. But more than that, you probably want to see it rise more than the market average. But Tieto Oyj (HEL:TIETO) has fallen short of that second goal, with a share price rise of 17% over five years, which is below the market return. However, if you include the dividends then the return is market beating. The last year has been disappointing, with the stock price down 16% in that time.
See our latest analysis for Tieto Oyj
While markets are a powerful pricing mechanism, share prices reflect investor sentiment, not just underlying business performance. By comparing earnings per share (EPS) and share price changes over time, we can get a feel for how investor attitudes to a company have morphed over time.
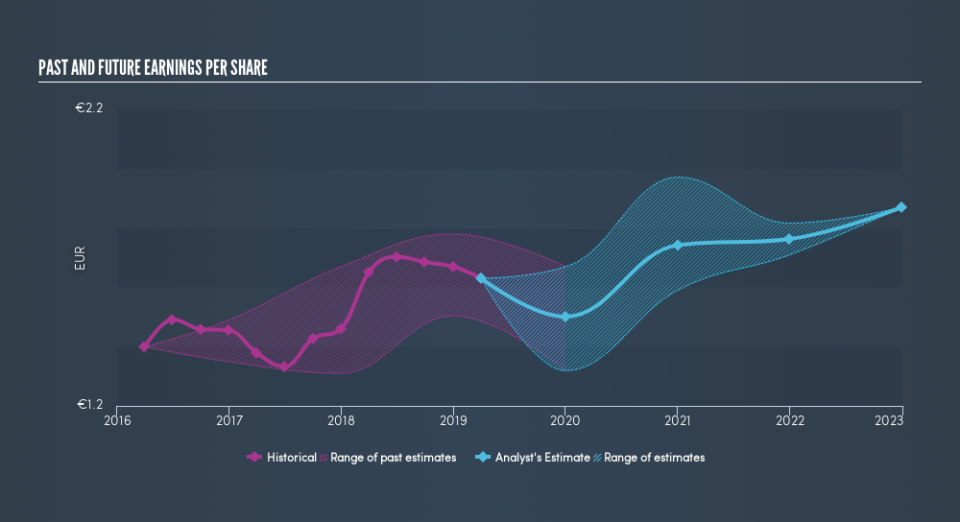
During five years of share price growth, Tieto Oyj achieved compound earnings per share (EPS) growth of 13% per year. The EPS growth is more impressive than the yearly share price gain of 3.2% over the same period. Therefore, it seems the market has become relatively pessimistic about the company.
The graphic below depicts how EPS has changed over time (unveil the exact values by clicking on the image).
This free interactive report on Tieto Oyj's earnings, revenue and cash flow is a great place to start, if you want to investigate the stock further.
What About Dividends?
When looking at investment returns, it is important to consider the difference between total shareholder return (TSR) and share price return. The TSR is a return calculation that accounts for the value of cash dividends (assuming that any dividend received was reinvested) and the calculated value of any discounted capital raisings and spin-offs. So for companies that pay a generous dividend, the TSR is often a lot higher than the share price return. We note that for Tieto Oyj the TSR over the last 5 years was 54%, which is better than the share price return mentioned above. The dividends paid by the company have thusly boosted the total shareholder return.
A Different Perspective
While the broader market lost about 5.9% in the twelve months, Tieto Oyj shareholders did even worse, losing 12% (even including dividends). However, it could simply be that the share price has been impacted by broader market jitters. It might be worth keeping an eye on the fundamentals, in case there's a good opportunity. On the bright side, long term shareholders have made money, with a gain of 9.0% per year over half a decade. It could be that the recent sell-off is an opportunity, so it may be worth checking the fundamental data for signs of a long term growth trend. Importantly, we haven't analysed Tieto Oyj's dividend history. This free visual report on its dividends is a must-read if you're thinking of buying.
If you are like me, then you will not want to miss this free list of growing companies that insiders are buying.
Please note, the market returns quoted in this article reflect the market weighted average returns of stocks that currently trade on FI exchanges.
We aim to bring you long-term focused research analysis driven by fundamental data. Note that our analysis may not factor in the latest price-sensitive company announcements or qualitative material.
If you spot an error that warrants correction, please contact the editor at editorial-team@simplywallst.com. This article by Simply Wall St is general in nature. It does not constitute a recommendation to buy or sell any stock, and does not take account of your objectives, or your financial situation. Simply Wall St has no position in the stocks mentioned. Thank you for reading.
