
 Yahoo Finance
 Should TKH Group N.V. (AMS:TWEKA) Be Part Of Your Dividend Portfolio?

A sizeable part of portfolio returns can be produced by dividend stocks due to their contribution to compounding returns in the long run. Historically, TKH Group N.V. (AMS:TWEKA) has paid a dividend to shareholders. It currently yields 2.7%. Does TKH Group tick all the boxes of a great dividend stock? Below, I’ll take you through my analysis.
Check out our latest analysis for TKH Group
5 questions to ask before buying a dividend stock
When assessing a stock as a potential addition to my dividend Portfolio, I look at these five areas:
Is it the top 25% annual dividend yield payer?
Does it consistently pay out dividends without missing a payment of significantly cutting payout?
Has it increased its dividend per share amount over the past?
Is its earnings sufficient to payout dividend at the current rate?
Will it be able to continue to payout at the current rate in the future?
How does TKH Group fare?
TKH Group has a trailing twelve-month payout ratio of 51%, which means that the dividend is covered by earnings. Going forward, analysts expect TWEKA’s payout to remain around the same level at 54% of its earnings. Assuming a constant share price, this equates to a dividend yield of around 4.1%. Moreover, EPS should increase to €2.74.
When considering the sustainability of dividends, it is also worth checking the cash flow of a company. Companies with strong cash flow can sustain a higher payout ratio, while companies with weaker cash flow generally cannot.
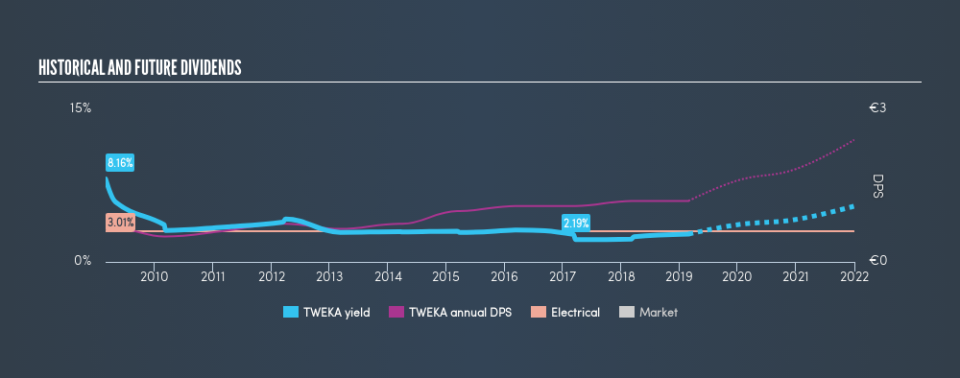
If there’s one type of stock you want to be reliable, it’s dividend stocks and their stable income-generating ability. Whilst its per-share payments have increased during the past 10 years, there has been some hiccups. Investors have seen reductions in the dividend per share in the past, although, it has picked up again.
Relative to peers, TKH Group produces a yield of 2.7%, which is high for Electrical stocks but still below the market’s top dividend payers.
Next Steps:
Taking into account the dividend metrics, TKH Group ticks most of the boxes as a strong dividend investment, putting it in my list of top dividend payers. Given that this is purely a dividend analysis, you should always research extensively before deciding whether or not a stock is an appropriate investment for you. I always recommend analysing the company’s fundamentals and underlying business before making an investment decision. There are three key factors you should look at:
Future Outlook: What are well-informed industry analysts predicting for TWEKA’s future growth? Take a look at our free research report of analyst consensus for TWEKA’s outlook.
Valuation: What is TWEKA worth today? Even if the stock is a cash cow, it’s not worth an infinite price. The intrinsic value infographic in our free research report helps visualize whether TWEKA is currently mispriced by the market.
Other Dividend Rockstars: Are there better dividend payers with stronger fundamentals out there? Check out our free list of these great stocks here.
We aim to bring you long-term focused research analysis driven by fundamental data. Note that our analysis may not factor in the latest price-sensitive company announcements or qualitative material.
If you spot an error that warrants correction, please contact the editor at editorial-team@simplywallst.com. This article by Simply Wall St is general in nature. It does not constitute a recommendation to buy or sell any stock, and does not take account of your objectives, or your financial situation. Simply Wall St has no position in the stocks mentioned. Thank you for reading.
