
 Yahoo Finance
 The Tomra Systems (OB:TOM) Share Price Has Soared 317%, Delighting Many Shareholders

Long term investing can be life changing when you buy and hold the truly great businesses. And highest quality companies can see their share prices grow by huge amounts. Don’t believe it? Then look at the Tomra Systems ASA (OB:TOM) share price. It’s 317% higher than it was five years ago. If that doesn’t get you thinking about long term investing, we don’t know what will. On top of that, the share price is up 11% in about a quarter. The company reported its financial results recently; you can catch up on the latest numbers by reading our company report.
View our latest analysis for Tomra Systems
While the efficient markets hypothesis continues to be taught by some, it has been proven that markets are over-reactive dynamic systems, and investors are not always rational. One flawed but reasonable way to assess how sentiment around a company has changed is to compare the earnings per share (EPS) with the share price.
During five years of share price growth, Tomra Systems achieved compound earnings per share (EPS) growth of 14% per year. This EPS growth is lower than the 33% average annual increase in the share price. So it’s fair to assume the market has a higher opinion of the business than it did five years ago. And that’s hardly shocking given the track record of growth. This optimism is visible in its fairly high P/E ratio of 46.81.
You can see how EPS has changed over time in the image below (click on the chart to see the exact values).
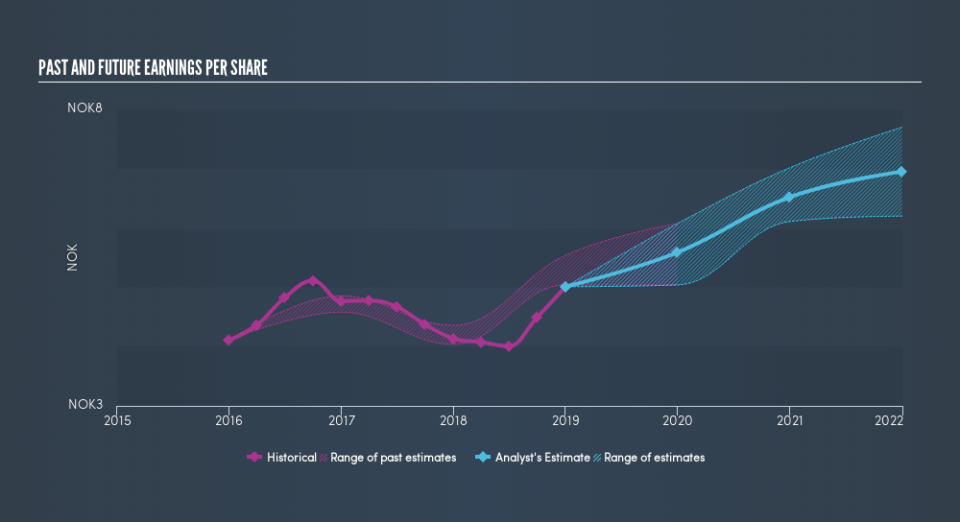
We know that Tomra Systems has improved its bottom line lately, but is it going to grow revenue? If you’re interested, you could check this free report showing consensus revenue forecasts.
What About Dividends?
It is important to consider the total shareholder return, as well as the share price return, for any given stock. The TSR incorporates the value of any discounted capital raisings, along with any dividends, based on the assumption that the dividends are reinvested. It’s fair to say that the TSR gives a more complete picture for stocks that pay a dividend. As it happens, Tomra Systems’s TSR for the last 5 years was 361%, which exceeds the share price return mentioned earlier. This is largely a result of its dividend payments!
A Different Perspective
It’s nice to see that Tomra Systems shareholders have received a total shareholder return of 73% over the last year. That’s including the dividend. That’s better than the annualised return of 36% over half a decade, implying that the company is doing better recently. In the best case scenario, this may hint at some real business momentum, implying that now could be a great time to delve deeper. Before spending more time on Tomra Systems it might be wise to click here to see if insiders have been buying or selling shares.
But note: Tomra Systems may not be the best stock to buy. So take a peek at this free list of interesting companies with past earnings growth (and further growth forecast).
Please note, the market returns quoted in this article reflect the market weighted average returns of stocks that currently trade on NO exchanges.
We aim to bring you long-term focused research analysis driven by fundamental data. Note that our analysis may not factor in the latest price-sensitive company announcements or qualitative material.
If you spot an error that warrants correction, please contact the editor at editorial-team@simplywallst.com. This article by Simply Wall St is general in nature. It does not constitute a recommendation to buy or sell any stock, and does not take account of your objectives, or your financial situation. Simply Wall St has no position in the stocks mentioned. Thank you for reading.
