
 Yahoo Finance
 TomTom N.V. (AMS:TOM2): What Does Its Beta Value Mean For Your Portfolio?

If you own shares in TomTom N.V. (AMS:TOM2) then it's worth thinking about how it contributes to the volatility of your portfolio, overall. In finance, Beta is a measure of volatility. Volatility is considered to be a measure of risk in modern finance theory. Investors may think of volatility as falling into two main categories. The first type is company specific volatility. Investors use diversification across uncorrelated stocks to reduce this kind of price volatility across the portfolio. The second sort is caused by the natural volatility of markets, overall. For example, certain macroeconomic events will impact (virtually) all stocks on the market.
Some stocks mimic the volatility of the market quite closely, while others demonstrate muted, exagerrated or uncorrelated price movements. Beta can be a useful tool to understand how much a stock is influenced by market risk (volatility). However, Warren Buffett said 'volatility is far from synonymous with risk' in his 2014 letter to investors. So, while useful, beta is not the only metric to consider. To use beta as an investor, you must first understand that the overall market has a beta of one. Any stock with a beta of greater than one is considered more volatile than the market, while those with a beta below one are either less volatile or poorly correlated with the market.
See our latest analysis for TomTom
What TOM2's beta value tells investors
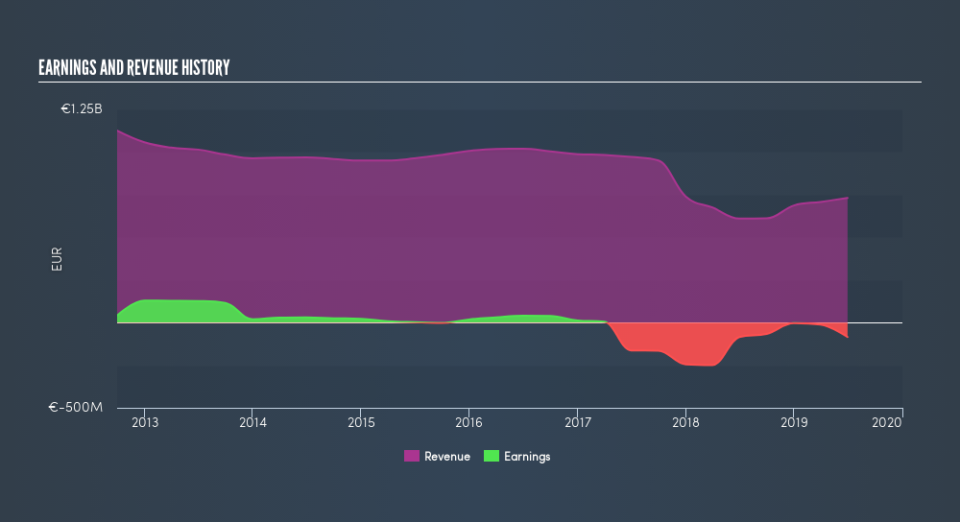
Given that it has a beta of 1.49, we can surmise that the TomTom share price has been fairly sensitive to market volatility (over the last 5 years). Based on this history, investors should be aware that TomTom are likely to rise strongly in times of greed, but sell off in times of fear. Many would argue that beta is useful in position sizing, but fundamental metrics such as revenue and earnings are more important overall. You can see TomTom's revenue and earnings in the image below.
How does TOM2's size impact its beta?
With a market capitalisation of €1.4b, TomTom is a small cap stock. However, it is big enough to catch the attention of professional investors. It has a relatively high beta, which is not unusual among small-cap stocks. Because it takes less capital to move the share price of a smaller company, actively traded small-cap stocks often have a higher beta that a similar large-cap stock.
What this means for you:
Since TomTom tends to moves up when the market is going up, and down when it's going down, potential investors may wish to reflect on the overall market, when considering the stock. In order to fully understand whether TOM2 is a good investment for you, we also need to consider important company-specific fundamentals such as TomTom’s financial health and performance track record. I highly recommend you dive deeper by considering the following:
Future Outlook: What are well-informed industry analysts predicting for TOM2’s future growth? Take a look at our free research report of analyst consensus for TOM2’s outlook.
Past Track Record: Has TOM2 been consistently performing well irrespective of the ups and downs in the market? Go into more detail in the past performance analysis and take a look at the free visual representations of TOM2's historicals for more clarity.
Other Interesting Stocks: It's worth checking to see how TOM2 measures up against other companies on valuation. You could start with this free list of prospective options.
We aim to bring you long-term focused research analysis driven by fundamental data. Note that our analysis may not factor in the latest price-sensitive company announcements or qualitative material.
If you spot an error that warrants correction, please contact the editor at editorial-team@simplywallst.com. This article by Simply Wall St is general in nature. It does not constitute a recommendation to buy or sell any stock, and does not take account of your objectives, or your financial situation. Simply Wall St has no position in the stocks mentioned. Thank you for reading.
