
 Yahoo Finance
 Has TomTom N.V. (AMS:TOM2) Got Enough Cash?

Mid-caps stocks, like TomTom N.V. (AMS:TOM2) with a market capitalization of €1.9b, aren’t the focus of most investors who prefer to direct their investments towards either large-cap or small-cap stocks. While they are less talked about as an investment category, mid-cap risk-adjusted returns have generally been better than more commonly focused stocks that fall into the small- or large-cap categories. TOM2’s financial liquidity and debt position will be analysed in this article, to get an idea of whether the company can fund opportunities for strategic growth and maintain strength through economic downturns. Note that this information is centred entirely on financial health and is a top-level understanding, so I encourage you to look further into TOM2 here.
See our latest analysis for TomTom
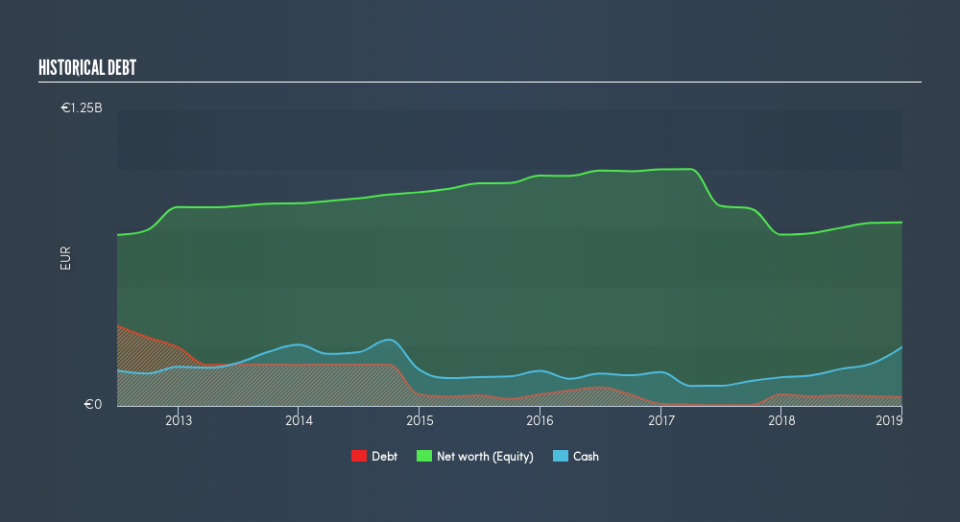
TOM2’s Debt (And Cash Flows)
TOM2 has shrunk its total debt levels in the last twelve months, from €48m to €39m – this includes long-term debt. With this debt payback, TOM2 currently has €248m remaining in cash and short-term investments , ready to be used for running the business. Additionally, TOM2 has generated €229m in operating cash flow over the same time period, leading to an operating cash to total debt ratio of 591%, signalling that TOM2’s debt is appropriately covered by operating cash.
Can TOM2 pay its short-term liabilities?
With current liabilities at €397m, it appears that the company has been able to meet these commitments with a current assets level of €587m, leading to a 1.48x current account ratio. The current ratio is calculated by dividing current assets by current liabilities. For Consumer Durables companies, this ratio is within a sensible range since there's a sufficient cash cushion without leaving too much capital idle or in low-earning investments.
Does TOM2 face the risk of succumbing to its debt-load?
With a debt-to-equity ratio of 5.0%, TOM2's debt level is relatively low. TOM2 is not taking on too much debt commitment, which may be constraining for future growth. Risk around debt is extremely low for TOM2, and the company also has the ability and headroom to increase debt if needed going forward.
Next Steps:
TOM2’s high cash coverage and low debt levels indicate its ability to utilise its borrowings efficiently in order to generate ample cash flow. Furthermore, the company exhibits an ability to meet its near term obligations should an adverse event occur. This is only a rough assessment of financial health, and I'm sure TOM2 has company-specific issues impacting its capital structure decisions. I suggest you continue to research TomTom to get a better picture of the stock by looking at:
Future Outlook: What are well-informed industry analysts predicting for TOM2’s future growth? Take a look at our free research report of analyst consensus for TOM2’s outlook.
Valuation: What is TOM2 worth today? Is the stock undervalued, even when its growth outlook is factored into its intrinsic value? The intrinsic value infographic in our free research report helps visualize whether TOM2 is currently mispriced by the market.
Other High-Performing Stocks: Are there other stocks that provide better prospects with proven track records? Explore our free list of these great stocks here.
We aim to bring you long-term focused research analysis driven by fundamental data. Note that our analysis may not factor in the latest price-sensitive company announcements or qualitative material.
If you spot an error that warrants correction, please contact the editor at editorial-team@simplywallst.com. This article by Simply Wall St is general in nature. It does not constitute a recommendation to buy or sell any stock, and does not take account of your objectives, or your financial situation. Simply Wall St has no position in the stocks mentioned. Thank you for reading.
