
 Yahoo Finance
 Topdanmark A/S's Dividend Analysis
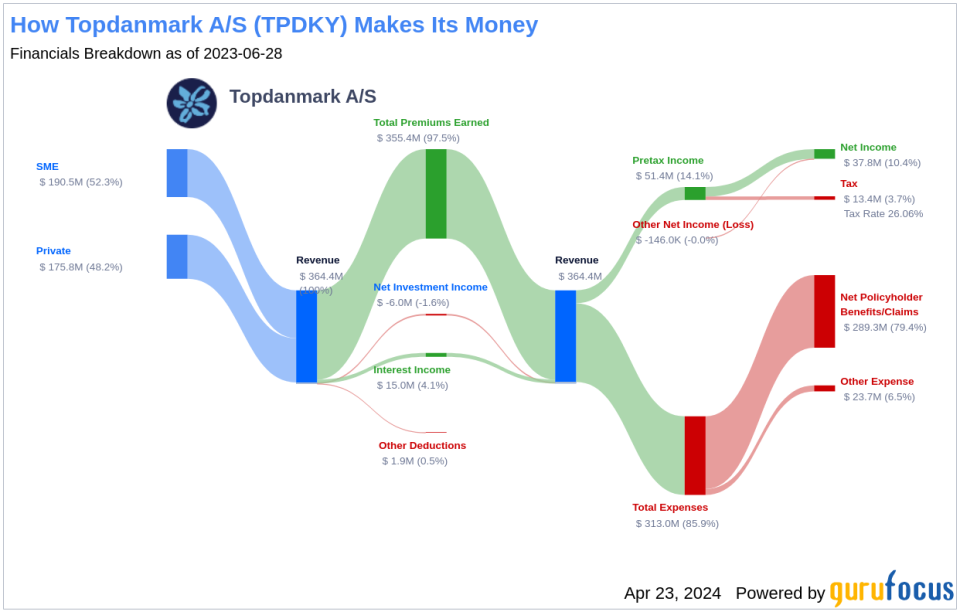
Assessing Topdanmark A/S's Dividend Performance and Sustainability
Topdanmark A/S (TPDKY) recently announced a dividend of $0.17 per share, payable on 2024-05-13, with the ex-dividend date set for 2024-04-24. As investors look forward to this upcoming payment, the spotlight also shines on the company's dividend history, yield, and growth rates. Using the data from GuruFocus, let's look into Topdanmark A/S's dividend performance and assess its sustainability.
What Does Topdanmark A/S Do?
This Powerful Chart Made Peter Lynch 29% A Year For 13 Years
How to calculate the intrinsic value of a stock?
Topdanmark A/S is a diversified insurance company that offers a variety of insurance products in Denmark. The company strives to maintain an expense ratio lower than the general market. Topdanmark offers life insurance, as well as non-life insurance products that cover private households and small businesses. The companys insurance business is segmented into three: Private offers non-life insurance policies to individual households in Denmark. This segment also includes illness and accident insurance offered through the life company; SME offers non-life insurance policies to Danish-based agricultural and SME businesses; Life offers products within life insurance and pension funds to both private and SME customers in Denmark.
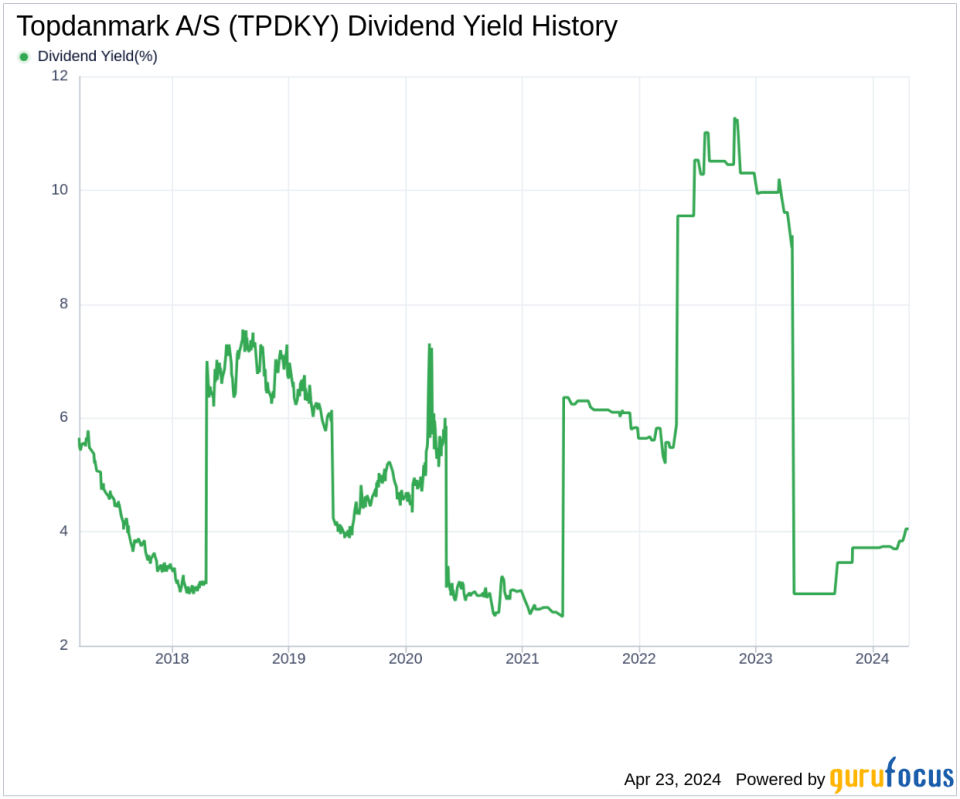
A Glimpse at Topdanmark A/S's Dividend History
Topdanmark A/S has maintained a consistent dividend payment record since 2017. Dividends are currently distributed on a yearly basis. Below is a chart showing annual Dividends Per Share for tracking historical trends.
Breaking Down Topdanmark A/S's Dividend Yield and Growth
As of today, Topdanmark A/S currently has a 12-month trailing dividend yield of 4.04% and a 12-month forward dividend yield of 4.16%. This suggests an expectation of increased dividend payments over the next 12 months.
Over the past three years, Topdanmark A/S's annual dividend growth rate was 9.00%. Extended to a five-year horizon, this rate decreased to -3.10% per year. Based on Topdanmark A/S's dividend yield and five-year growth rate, the 5-year yield on cost of Topdanmark A/S stock as of today is approximately 3.45%.
The Sustainability Question: Payout Ratio and Profitability
To assess the sustainability of the dividend, one needs to evaluate the company's payout ratio. The dividend payout ratio provides insights into the portion of earnings the company distributes as dividends. A lower ratio suggests that the company retains a significant part of its earnings, thereby ensuring the availability of funds for future growth and unexpected downturns. As of 2024-03-31, Topdanmark A/S's dividend payout ratio is 0.93, which may suggest that the company's dividend may not be sustainable.
Topdanmark A/S's profitability rank, offers an understanding of the company's earnings prowess relative to its peers. GuruFocus ranks Topdanmark A/S's profitability 5 out of 10 as of 2024-03-31, suggesting fair profitability. The company has reported positive net income for each of year over the past decade, further solidifying its high profitability.
Growth Metrics: The Future Outlook
To ensure the sustainability of dividends, a company must have robust growth metrics. Topdanmark A/S's growth rank of 5 out of 10 suggests that the company has a fair growth outlook. Revenue is the lifeblood of any company, and Topdanmark A/S's revenue per share, combined with the 3-year revenue growth rate, indicates a strong revenue model. Topdanmark A/S's revenue has increased by approximately -27.20% per year on average, a rate that underperforms than approximately 93.63% of global competitors.
The company's 3-year EPS growth rate showcases its capability to grow its earnings, a critical component for sustaining dividends in the long run. During the past three years, Topdanmark A/S's earnings increased by approximately -2.90% per year on average, a rate that underperforms than approximately 68.47% of global competitors.
Lastly, the company's 5-year EBITDA growth rate of -5.40%, which underperforms than approximately 79.6% of global competitors.
Next Steps
Considering Topdanmark A/S's dividend payments, dividend growth rate, payout ratio, profitability, and growth metrics, investors must weigh the potential rewards against the risks. With a history of consistent dividend payments but a dividend payout ratio that could raise sustainability concerns, it is crucial for investors to monitor the company's financial health and future earnings potential. While the profitability rank reflects a stable financial position, the growth metrics indicate areas where improvement is necessary to ensure long-term dividend sustainability. Investors should keep an eye on these indicators to make informed decisions about their investment in Topdanmark A/S.
GuruFocus Premium users can screen for high-dividend yield stocks using the High Dividend Yield Screener.
This article, generated by GuruFocus, is designed to provide general insights and is not tailored financial advice. Our commentary is rooted in historical data and analyst projections, utilizing an impartial methodology, and is not intended to serve as specific investment guidance. It does not formulate a recommendation to purchase or divest any stock and does not consider individual investment objectives or financial circumstances. Our objective is to deliver long-term, fundamental data-driven analysis. Be aware that our analysis might not incorporate the most recent, price-sensitive company announcements or qualitative information. GuruFocus holds no position in the stocks mentioned herein.
This article first appeared on GuruFocus.
