
 Yahoo Finance
 The total return for LKQ (NASDAQ:LKQ) investors has risen faster than earnings growth over the last three years
By buying an index fund, you can roughly match the market return with ease. But if you pick the right individual stocks, you could make more than that. For example, LKQ Corporation (NASDAQ:LKQ) shareholders have seen the share price rise 95% over three years, well in excess of the market return (33%, not including dividends). However, more recent returns haven't been as impressive as that, with the stock returning just 4.4% in the last year , including dividends .
In light of the stock dropping 3.9% in the past week, we want to investigate the longer term story, and see if fundamentals have been the driver of the company's positive three-year return.
Check out our latest analysis for LKQ
While markets are a powerful pricing mechanism, share prices reflect investor sentiment, not just underlying business performance. By comparing earnings per share (EPS) and share price changes over time, we can get a feel for how investor attitudes to a company have morphed over time.
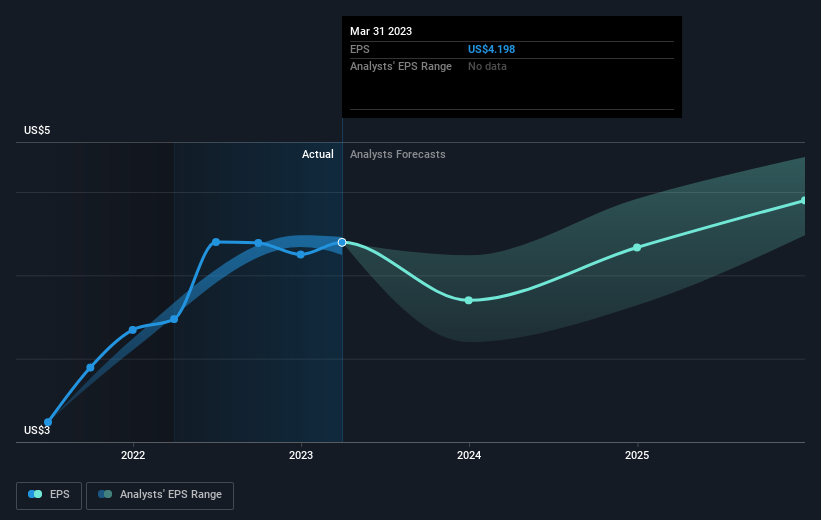
During three years of share price growth, LKQ achieved compound earnings per share growth of 31% per year. This EPS growth is higher than the 25% average annual increase in the share price. So one could reasonably conclude that the market has cooled on the stock.
The image below shows how EPS has tracked over time (if you click on the image you can see greater detail).
It is of course excellent to see how LKQ has grown profits over the years, but the future is more important for shareholders. You can see how its balance sheet has strengthened (or weakened) over time in this free interactive graphic.
What About Dividends?
When looking at investment returns, it is important to consider the difference between total shareholder return (TSR) and share price return. Whereas the share price return only reflects the change in the share price, the TSR includes the value of dividends (assuming they were reinvested) and the benefit of any discounted capital raising or spin-off. So for companies that pay a generous dividend, the TSR is often a lot higher than the share price return. We note that for LKQ the TSR over the last 3 years was 102%, which is better than the share price return mentioned above. This is largely a result of its dividend payments!
A Different Perspective
We're pleased to report that LKQ shareholders have received a total shareholder return of 4.4% over one year. Of course, that includes the dividend. However, the TSR over five years, coming in at 12% per year, is even more impressive. Potential buyers might understandably feel they've missed the opportunity, but it's always possible business is still firing on all cylinders. It's always interesting to track share price performance over the longer term. But to understand LKQ better, we need to consider many other factors. Take risks, for example - LKQ has 3 warning signs we think you should be aware of.
Of course, you might find a fantastic investment by looking elsewhere. So take a peek at this free list of companies we expect will grow earnings.
Please note, the market returns quoted in this article reflect the market weighted average returns of stocks that currently trade on American exchanges.
Have feedback on this article? Concerned about the content? Get in touch with us directly. Alternatively, email editorial-team (at) simplywallst.com.
This article by Simply Wall St is general in nature. We provide commentary based on historical data and analyst forecasts only using an unbiased methodology and our articles are not intended to be financial advice. It does not constitute a recommendation to buy or sell any stock, and does not take account of your objectives, or your financial situation. We aim to bring you long-term focused analysis driven by fundamental data. Note that our analysis may not factor in the latest price-sensitive company announcements or qualitative material. Simply Wall St has no position in any stocks mentioned.
Join A Paid User Research Session
You’ll receive a US$30 Amazon Gift card for 1 hour of your time while helping us build better investing tools for the individual investors like yourself. Sign up here
