
 Yahoo Finance
 The total return for SolarEdge Technologies (NASDAQ:SEDG) investors has risen faster than earnings growth over the last five years
Buying shares in the best businesses can build meaningful wealth for you and your family. And highest quality companies can see their share prices grow by huge amounts. To wit, the SolarEdge Technologies, Inc. (NASDAQ:SEDG) share price has soared 971% over five years. This just goes to show the value creation that some businesses can achieve. It's also good to see the share price up 11% over the last quarter. This could be related to the recent financial results, released recently - you can catch up on the most recent data by reading our company report. We love happy stories like this one. The company should be really proud of that performance!
While this past week has detracted from the company's five-year return, let's look at the recent trends of the underlying business and see if the gains have been in alignment.
Check out our latest analysis for SolarEdge Technologies
There is no denying that markets are sometimes efficient, but prices do not always reflect underlying business performance. By comparing earnings per share (EPS) and share price changes over time, we can get a feel for how investor attitudes to a company have morphed over time.
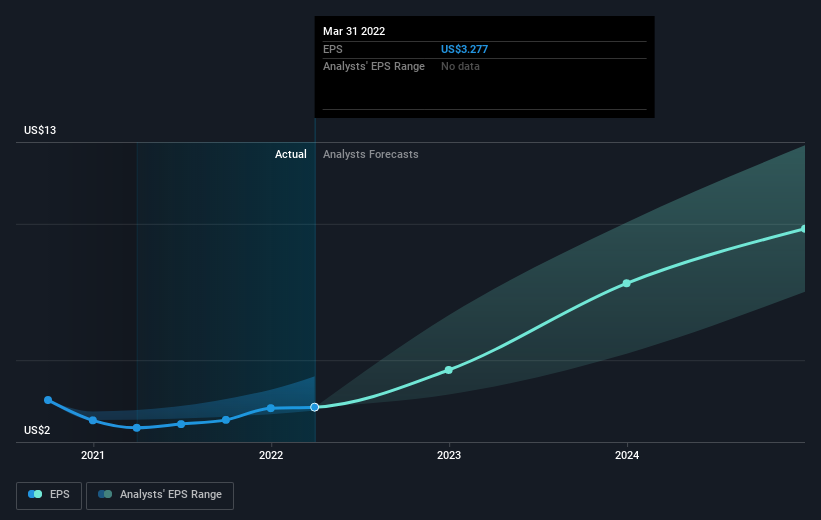
During five years of share price growth, SolarEdge Technologies achieved compound earnings per share (EPS) growth of 16% per year. This EPS growth is slower than the share price growth of 61% per year, over the same period. This suggests that market participants hold the company in higher regard, these days. And that's hardly shocking given the track record of growth. This optimism is visible in its fairly high P/E ratio of 95.47.
The company's earnings per share (over time) is depicted in the image below (click to see the exact numbers).
It's probably worth noting that the CEO is paid less than the median at similar sized companies. It's always worth keeping an eye on CEO pay, but a more important question is whether the company will grow earnings throughout the years. This free interactive report on SolarEdge Technologies' earnings, revenue and cash flow is a great place to start, if you want to investigate the stock further.
A Different Perspective
We're pleased to report that SolarEdge Technologies shareholders have received a total shareholder return of 1.0% over one year. However, that falls short of the 61% TSR per annum it has made for shareholders, each year, over five years. Potential buyers might understandably feel they've missed the opportunity, but it's always possible business is still firing on all cylinders. It's always interesting to track share price performance over the longer term. But to understand SolarEdge Technologies better, we need to consider many other factors. Consider risks, for instance. Every company has them, and we've spotted 2 warning signs for SolarEdge Technologies you should know about.
But note: SolarEdge Technologies may not be the best stock to buy. So take a peek at this free list of interesting companies with past earnings growth (and further growth forecast).
Please note, the market returns quoted in this article reflect the market weighted average returns of stocks that currently trade on US exchanges.
Have feedback on this article? Concerned about the content? Get in touch with us directly. Alternatively, email editorial-team (at) simplywallst.com.
This article by Simply Wall St is general in nature. We provide commentary based on historical data and analyst forecasts only using an unbiased methodology and our articles are not intended to be financial advice. It does not constitute a recommendation to buy or sell any stock, and does not take account of your objectives, or your financial situation. We aim to bring you long-term focused analysis driven by fundamental data. Note that our analysis may not factor in the latest price-sensitive company announcements or qualitative material. Simply Wall St has no position in any stocks mentioned.
Join A Paid User Research Session
You’ll receive a US$30 Amazon Gift card for 1 hour of your time while helping us build better investing tools for the individual investors like yourself. Sign up here
