
 Yahoo Finance
 The total return for Textainer Group Holdings (NYSE:TGH) investors has risen faster than earnings growth over the last three years
It hasn't been the best quarter for Textainer Group Holdings Limited (NYSE:TGH) shareholders, since the share price has fallen 22% in that time. But in three years the returns have been great. In three years the stock price has launched 212% higher: a great result. After a run like that some may not be surprised to see prices moderate. The thing to consider is whether the underlying business is doing well enough to support the current price.
In light of the stock dropping 6.8% in the past week, we want to investigate the longer term story, and see if fundamentals have been the driver of the company's positive three-year return.
View our latest analysis for Textainer Group Holdings
To quote Buffett, 'Ships will sail around the world but the Flat Earth Society will flourish. There will continue to be wide discrepancies between price and value in the marketplace...' One way to examine how market sentiment has changed over time is to look at the interaction between a company's share price and its earnings per share (EPS).
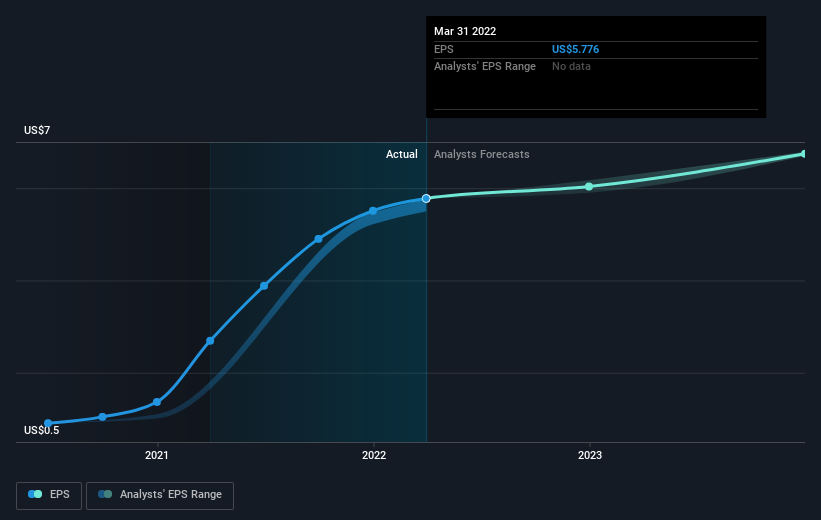
During three years of share price growth, Textainer Group Holdings achieved compound earnings per share growth of 91% per year. The average annual share price increase of 46% is actually lower than the EPS growth. So it seems investors have become more cautious about the company, over time. This cautious sentiment is reflected in its (fairly low) P/E ratio of 5.35.
The image below shows how EPS has tracked over time (if you click on the image you can see greater detail).
It's probably worth noting that the CEO is paid less than the median at similar sized companies. It's always worth keeping an eye on CEO pay, but a more important question is whether the company will grow earnings throughout the years. Dive deeper into the earnings by checking this interactive graph of Textainer Group Holdings' earnings, revenue and cash flow.
What About Dividends?
When looking at investment returns, it is important to consider the difference between total shareholder return (TSR) and share price return. The TSR incorporates the value of any spin-offs or discounted capital raisings, along with any dividends, based on the assumption that the dividends are reinvested. Arguably, the TSR gives a more comprehensive picture of the return generated by a stock. We note that for Textainer Group Holdings the TSR over the last 3 years was 216%, which is better than the share price return mentioned above. The dividends paid by the company have thusly boosted the total shareholder return.
A Different Perspective
It's nice to see that Textainer Group Holdings shareholders have received a total shareholder return of 26% over the last year. And that does include the dividend. Since the one-year TSR is better than the five-year TSR (the latter coming in at 23% per year), it would seem that the stock's performance has improved in recent times. Someone with an optimistic perspective could view the recent improvement in TSR as indicating that the business itself is getting better with time. While it is well worth considering the different impacts that market conditions can have on the share price, there are other factors that are even more important. Case in point: We've spotted 4 warning signs for Textainer Group Holdings you should be aware of, and 2 of them don't sit too well with us.
Of course, you might find a fantastic investment by looking elsewhere. So take a peek at this free list of companies we expect will grow earnings.
Please note, the market returns quoted in this article reflect the market weighted average returns of stocks that currently trade on US exchanges.
Have feedback on this article? Concerned about the content? Get in touch with us directly. Alternatively, email editorial-team (at) simplywallst.com.
This article by Simply Wall St is general in nature. We provide commentary based on historical data and analyst forecasts only using an unbiased methodology and our articles are not intended to be financial advice. It does not constitute a recommendation to buy or sell any stock, and does not take account of your objectives, or your financial situation. We aim to bring you long-term focused analysis driven by fundamental data. Note that our analysis may not factor in the latest price-sensitive company announcements or qualitative material. Simply Wall St has no position in any stocks mentioned.
