
 Yahoo Finance
 Towns and cities where house prices have increased the most and least in 2022
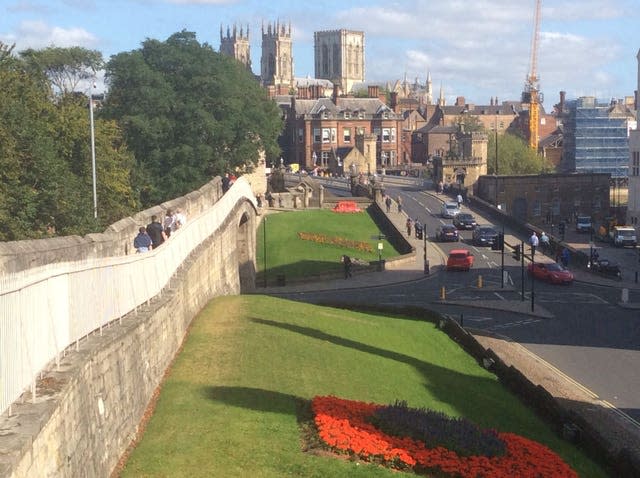
York has recorded the strongest house price inflation across England and Wales’s towns and cities in 2022, according to analysis.
Over the past year, house prices in the historic Yorkshire city have grown by 23.1%, or £69,648 on average in cash terms, Halifax found.
Since March 2020, the month when the coronavirus lockdowns started in the UK, average house prices in York have surged by 41.9% or £109,457, meaning typical property values there have risen to £370,639.
Enveloped within Roman walls, the city’s attractions include York Minster, medieval shopping streets such as the Shambles, historic pubs, the Yorvik Viking Centre and York Dungeon.
People with a sweet tooth will also find much to do in the city, which boasts Bettys cafe tea rooms and York’s Chocolate Story.
York also has strong connections with highwayman Dick Turpin, who spent his final days there.
Meanwhile, Woking, with its good links to central London, saw the biggest average house price increase of any town or city in cash terms in 2022.
The cost of buying a home in the desirable commuter town leapt from £493,299 in 2021 to £586,925 as 2022 drew to a close – an increase of £93,626 or 19.0%.
In Wales, Swansea recorded the highest rate of house price growth, with prices there having increased by 17.5% or £39,450 annually.
Kim Kinnaird, mortgages director, Halifax, said: “Overall 2022 was another year of rapid house price growth for most areas in the UK.
“And unlike many years in the past, the list isn’t dominated by towns and cities in the South East.
“Nowhere is that more the case than in the cathedral city of York, which saw the highest property price inflation across England and Wales this year, rising by over a fifth.
“While existing homeowners will welcome the increased value of their home, such a jump makes it much more challenging for those looking to step on to the property ladder or move into the city.
“While London still has some of the highest property prices in the country, it recorded comparatively modest house price inflation over the last 12 months.
“This is partly due to pandemic-driven shifts in housing preferences as buyers sought bigger properties further from urban centres.
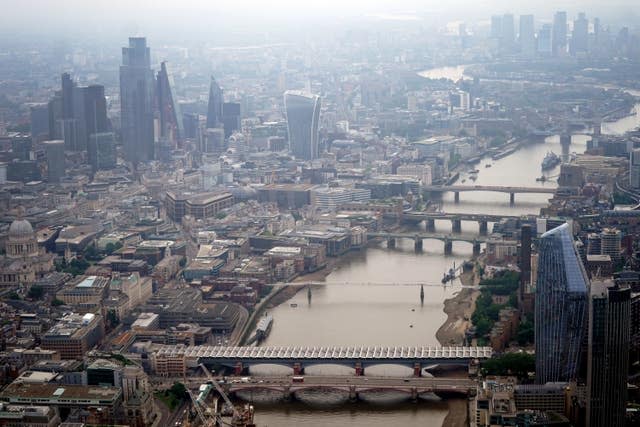
“We can see this clearly in commuter towns such as Woking, Chelmsford and Hove, which – with their more diverse range of properties perhaps offering better value – recorded much bigger increases over the last year.”
Tom Bill, head of UK residential research at estate agent Knight Frank, said: “This year saw the ‘escape to the country’ trend wind down while the return to towns and cities gathered pace.
“York captures the best of both of those worlds. Many people moved to Yorkshire during the pandemic due to family ties and the relative affordability compared to areas such as the Cotswolds.
“Meanwhile, the strength of south-east England underlines the gravitational pull of the capital as the economy reopens.
“London prices were more muted due to affordability constraints that predate the pandemic, which mean prices in the commuter belt and beyond should continue to outperform the capital in the medium-term.”
Here are the cities and towns in England and Wales with the strongest annual percentage increases in house prices, according to Halifax, with the region and the average house price followed by the increase in cash and percentage terms (figures show the change in the 12 months to November 2022):
1. York, Yorkshire and the, Humber, £370,639, £69,648, 23.1%
2. Woking, South East, £586,925, £93,626, 19.0%
3. Swansea, Wales, £265,379, £39,450 17.5%
4. Chelmsford, East of England, £485,770, £69,775, 16.8%
5. Kettering, East Midlands, £326,895, £44,731, 15.9%
6. Derby, East Midlands, £277,491, £37,953, 15.8%
7. Wellingborough, East Midlands, £306,985, £41,087, 15.5%
8. Peterborough, East of England, £289,994, £37,599, 14.9%
=9. Bristol, South West, £394,126, £50,864, 14.8%
=9. Cambridge, East of England, £531,730, £68,586, 14.8%
11. Brentwood, East of England, £533,327, £66,998, 14.4%
12. Bournemouth, South West, £365,148, £45,559, 14.3%
13. Hove, South East, £526,201, £65,255, 14.2%
14. Colchester, East of England, £377,003, £46,208, 14.0%
15. Birmingham, West Midlands, £269,385, £32,563, 13.8%
16. Milton Keynes, South East, £416,496, £49,594, 13.5%
17. Newcastle-upon-Tyne, North East, £260,675, £30,157, 13.1%
18. Nottingham, East Midlands, £286,696, £32,966, 13.0%
19. Southampton, South East, £316,286, £36,151, 12.9%
20. Cheltenham, South West, £406,767, £45,972, 12.7%
And here are the towns and cities with the weakest annual growth in house prices, according to Halifax (figures show the change in the 12 months to November 2022):
1. Leicester, East Midlands, £271,092, minus £10,212, minus 3.6%
2. Hull, Yorkshire and the Humber, £163,677, minus £4,956, minus 2.9%
3. Maidenhead, South East, £549,722, minus £12,326, minus 2.2%
4. Stoke-on-Trent, West Midlands, £183,928, minus £3,149, minus 1.7%
5. Islington, London, £712,843, £3,059, 0.4%
6. Tower Hamlets, London, £530,056, £3,582, 0.7%
7. Westminster, London, £770,517, £6,510, 0.9%
=8. Lambeth, London, £601,372, £8,224, 1.4%
=8. Weston-Super-Mare, South West, £264,569, £3,649, 1.4%
10. Hackney, London, £639,995, £10,743, 1.7%
=11. Harlow, East of England, £348,180, £6,227, 1.8%
=11. Warrington, North West, £282,457, £5,079, 1.8%
13. Huddersfield, Yorkshire and the Humber, £253,105, £4,773, 1.9%
14. Oldham, North West, £220,427, £4,309, 2.0%
15. Newport (City of), Wales, £247,245, £5,645, 2.3%
16. Wakefield, Yorkshire and the Humber, £243,589, £5,754, 2.4%
17. Southwark, London, £620,472, £15,043, 2.5%
18. Lewisham, London, £519,971, £13,558, 2.7%
19. Gloucester, South West, £286,914, £7,760, 2.8%
20. Camden, London, £773,263, £22,145, 2.9%
And here are average house prices in Wales, Scotland and Northern Ireland and the English regions, followed by the increase over the past year in cash and percentage terms, according to Halifax (figures show the change in the 12 months to November 2022):
– East Midlands, £292,427, £23,481, 8.7%
– East of England, £421,710, £43,431, 11.5%
– London, £596,667, £39,877, 7.2%
– North East, £221,983, £17,776, 8.7%
– Northern Ireland, £210,550, £21,560, 11.4%
– North West, £268,573, £23,442, 9.6%
– Scotland, £242,213, £23,814, 10.9%
– South East, £477,003, £58,970, 14.1%
– South West, £364,759, £39,025, 12.0%
– Wales, £257,695, £20,669, 8.7%
– West Midlands, £298,193, £26,801, 9.9%
– Yorkshire and the Humber, £259,031, £21,999, 9.3%
