
 Yahoo Finance
 Should TP ICAP (LON:TCAP) Be Disappointed With Their 27% Profit?

These days it's easy to simply buy an index fund, and your returns should (roughly) match the market. But if you pick the right individual stocks, you could make more than that. For example, the TP ICAP plc (LON:TCAP) share price is up 27% in the last year, clearly besting the market return of around 13% (not including dividends). So that should have shareholders smiling. Unfortunately the longer term returns are not so good, with the stock falling 9.4% in the last three years.
Check out our latest analysis for TP ICAP
In his essay The Superinvestors of Graham-and-Doddsville Warren Buffett described how share prices do not always rationally reflect the value of a business. One imperfect but simple way to consider how the market perception of a company has shifted is to compare the change in the earnings per share (EPS) with the share price movement.
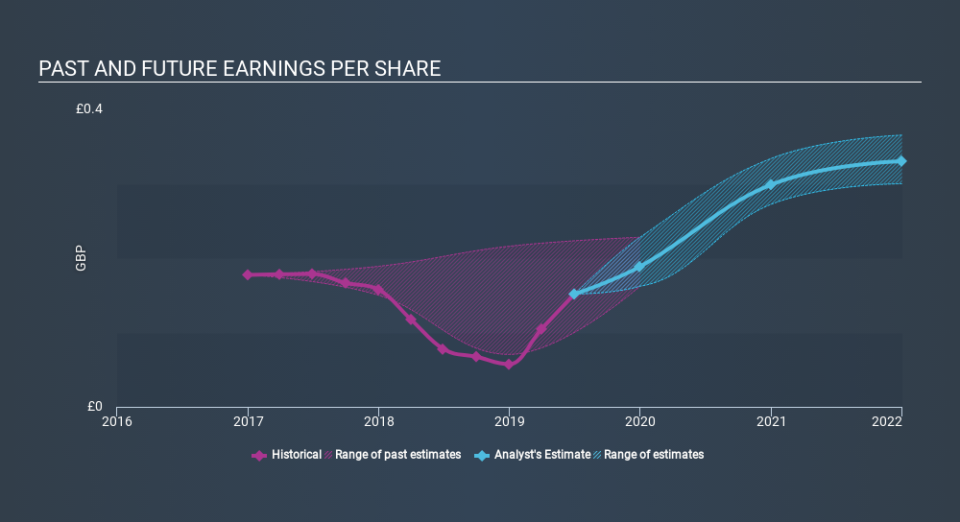
During the last year TP ICAP grew its earnings per share (EPS) by 95%. It's fair to say that the share price gain of 27% did not keep pace with the EPS growth. So it seems like the market has cooled on TP ICAP, despite the growth. Interesting.
You can see how EPS has changed over time in the image below (click on the chart to see the exact values).
We know that TP ICAP has improved its bottom line lately, but is it going to grow revenue? You could check out this free report showing analyst revenue forecasts.
What About Dividends?
When looking at investment returns, it is important to consider the difference between total shareholder return (TSR) and share price return. The TSR is a return calculation that accounts for the value of cash dividends (assuming that any dividend received was reinvested) and the calculated value of any discounted capital raisings and spin-offs. Arguably, the TSR gives a more comprehensive picture of the return generated by a stock. As it happens, TP ICAP's TSR for the last year was 34%, which exceeds the share price return mentioned earlier. This is largely a result of its dividend payments!
A Different Perspective
Pleasingly, TP ICAP's total shareholder return last year was 34%. And yes, that does include the dividend. That's better than the annualized TSR of 0.4% over the last three years. The improving returns to shareholders suggests the stock is becoming more popular with time. While it is well worth considering the different impacts that market conditions can have on the share price, there are other factors that are even more important. Consider risks, for instance. Every company has them, and we've spotted 2 warning signs for TP ICAP you should know about.
Of course, you might find a fantastic investment by looking elsewhere. So take a peek at this free list of companies we expect will grow earnings.
Please note, the market returns quoted in this article reflect the market weighted average returns of stocks that currently trade on GB exchanges.
If you spot an error that warrants correction, please contact the editor at editorial-team@simplywallst.com. This article by Simply Wall St is general in nature. It does not constitute a recommendation to buy or sell any stock, and does not take account of your objectives, or your financial situation. Simply Wall St has no position in the stocks mentioned.
We aim to bring you long-term focused research analysis driven by fundamental data. Note that our analysis may not factor in the latest price-sensitive company announcements or qualitative material. Thank you for reading.