
 Yahoo Finance
 Trans-China Automotive Holdings (Catalist:VI2) investors are sitting on a loss of 30% if they invested a year ago
It's easy to match the overall market return by buying an index fund. While individual stocks can be big winners, plenty more fail to generate satisfactory returns. Unfortunately the Trans-China Automotive Holdings Limited (Catalist:VI2) share price slid 31% over twelve months. That's well below the market decline of 3.3%. Trans-China Automotive Holdings may have better days ahead, of course; we've only looked at a one year period.
With that in mind, it's worth seeing if the company's underlying fundamentals have been the driver of long term performance, or if there are some discrepancies.
See our latest analysis for Trans-China Automotive Holdings
There is no denying that markets are sometimes efficient, but prices do not always reflect underlying business performance. One flawed but reasonable way to assess how sentiment around a company has changed is to compare the earnings per share (EPS) with the share price.
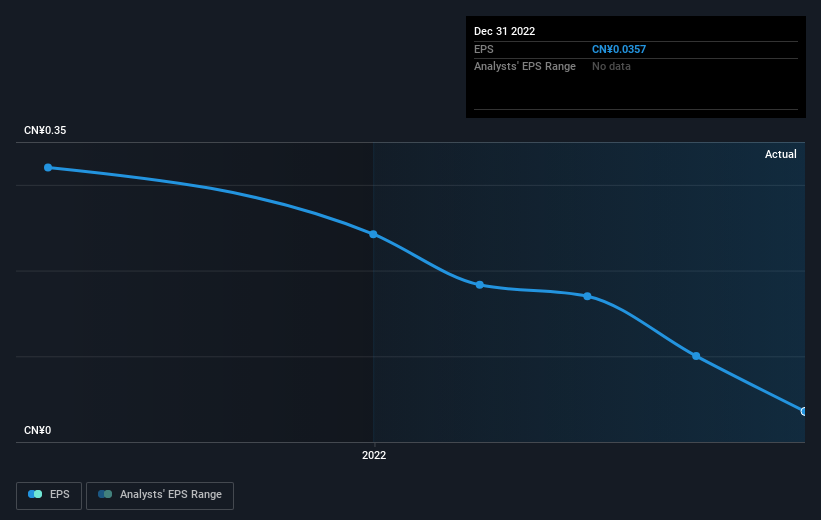
Unfortunately Trans-China Automotive Holdings reported an EPS drop of 85% for the last year. This fall in the EPS is significantly worse than the 31% the share price fall. So the market may not be too worried about the EPS figure, at the moment -- or it may have expected earnings to drop faster.
The company's earnings per share (over time) is depicted in the image below (click to see the exact numbers).
It's probably worth noting we've seen significant insider buying in the last quarter, which we consider a positive. That said, we think earnings and revenue growth trends are even more important factors to consider. This free interactive report on Trans-China Automotive Holdings' earnings, revenue and cash flow is a great place to start, if you want to investigate the stock further.
A Different Perspective
While Trans-China Automotive Holdings shareholders are down 30% for the year (even including dividends), the market itself is up 3.3%. While the aim is to do better than that, it's worth recalling that even great long-term investments sometimes underperform for a year or more. The share price decline has continued throughout the most recent three months, down 5.3%, suggesting an absence of enthusiasm from investors. Basically, most investors should be wary of buying into a poor-performing stock, unless the business itself has clearly improved. It's always interesting to track share price performance over the longer term. But to understand Trans-China Automotive Holdings better, we need to consider many other factors. For instance, we've identified 4 warning signs for Trans-China Automotive Holdings (1 can't be ignored) that you should be aware of.
If you like to buy stocks alongside management, then you might just love this free list of companies. (Hint: insiders have been buying them).
Please note, the market returns quoted in this article reflect the market weighted average returns of stocks that currently trade on Singaporean exchanges.
Have feedback on this article? Concerned about the content? Get in touch with us directly. Alternatively, email editorial-team (at) simplywallst.com.
This article by Simply Wall St is general in nature. We provide commentary based on historical data and analyst forecasts only using an unbiased methodology and our articles are not intended to be financial advice. It does not constitute a recommendation to buy or sell any stock, and does not take account of your objectives, or your financial situation. We aim to bring you long-term focused analysis driven by fundamental data. Note that our analysis may not factor in the latest price-sensitive company announcements or qualitative material. Simply Wall St has no position in any stocks mentioned.
