
 Yahoo Finance
 Trans-Siberian Gold’s (LON:TSG) Wonderful 311% Share Price Increase Shows How Capitalism Can Build Wealth

We think all investors should try to buy and hold high quality multi-year winners. While not every stock performs well, when investors win, they can win big. For example, the Trans-Siberian Gold plc (LON:TSG) share price is up a whopping 311% in the last half decade, a handsome return for long term holders. This just goes to show the value creation that some businesses can achieve. Also pleasing for shareholders was the 38% gain in the last three months.
View our latest analysis for Trans-Siberian Gold
To paraphrase Benjamin Graham: Over the short term the market is a voting machine, but over the long term it’s a weighing machine. One flawed but reasonable way to assess how sentiment around a company has changed is to compare the earnings per share (EPS) with the share price.
During the last half decade, Trans-Siberian Gold became profitable. That kind of transition can be an inflection point that justifies a strong share price gain, just as we have seen here. Since the company was unprofitable five years ago, but not three years ago, it’s worth taking a look at the returns in the last three years, too. Indeed, the Trans-Siberian Gold share price has gained 14% in three years. During the same period, EPS grew by 6.2% each year. This EPS growth is higher than the 4.4% average annual increase in the share price over the same three years. So you might conclude the market is a little more cautious about the stock, these days.
You can see below how EPS has changed over time (discover the exact values by clicking on the image).
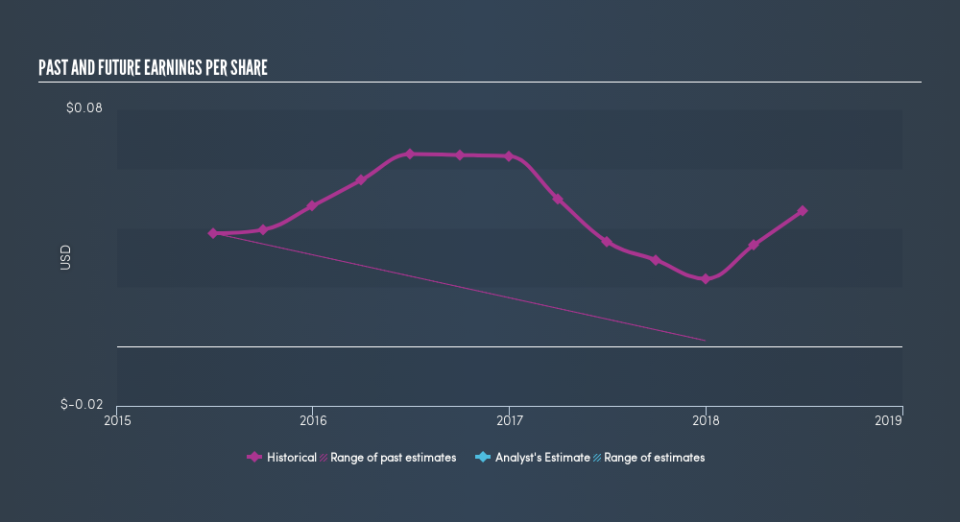
Dive deeper into Trans-Siberian Gold’s key metrics by checking this interactive graph of Trans-Siberian Gold’s earnings, revenue and cash flow.
What About Dividends?
When looking at investment returns, it is important to consider the difference between total shareholder return (TSR) and share price return. The TSR incorporates the value of any discounted capital raisings, along with any dividends, based on the assumption that the dividends are reinvested. It’s fair to say that the TSR gives a more complete picture for stocks that pay a dividend. As it happens, Trans-Siberian Gold’s TSR for the last 5 years was 458%, which exceeds the share price return mentioned earlier. This is largely a result of its dividend payments!
A Different Perspective
It’s nice to see that Trans-Siberian Gold shareholders have received a total shareholder return of 29% over the last year. And that does include the dividend. However, the TSR over five years, coming in at 41% per year, is even more impressive. Before forming an opinion on Trans-Siberian Gold you might want to consider the cold hard cash it pays as a dividend. This free chart tracks its dividend over time.
Of course, you might find a fantastic investment by looking elsewhere. So take a peek at this free list of companies we expect will grow earnings.
Please note, the market returns quoted in this article reflect the market weighted average returns of stocks that currently trade on GB exchanges.
We aim to bring you long-term focused research analysis driven by fundamental data. Note that our analysis may not factor in the latest price-sensitive company announcements or qualitative material.
If you spot an error that warrants correction, please contact the editor at editorial-team@simplywallst.com. This article by Simply Wall St is general in nature. It does not constitute a recommendation to buy or sell any stock, and does not take account of your objectives, or your financial situation. Simply Wall St has no position in the stocks mentioned. Thank you for reading.
