
 Yahoo Finance
 Trellidor Holdings (JSE:TRL) Has Some Difficulty Using Its Capital Effectively
When we're researching a company, it's sometimes hard to find the warning signs, but there are some financial metrics that can help spot trouble early. Businesses in decline often have two underlying trends, firstly, a declining return on capital employed (ROCE) and a declining base of capital employed. This indicates to us that the business is not only shrinking the size of its net assets, but its returns are falling as well. Having said that, after a brief look, Trellidor Holdings (JSE:TRL) we aren't filled with optimism, but let's investigate further.
What Is Return On Capital Employed (ROCE)?
Just to clarify if you're unsure, ROCE is a metric for evaluating how much pre-tax income (in percentage terms) a company earns on the capital invested in its business. The formula for this calculation on Trellidor Holdings is:
Return on Capital Employed = Earnings Before Interest and Tax (EBIT) ÷ (Total Assets - Current Liabilities)
0.11 = R22m ÷ (R431m - R226m) (Based on the trailing twelve months to June 2023).
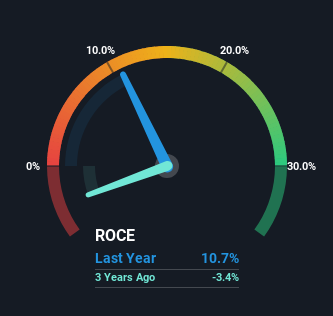
Therefore, Trellidor Holdings has an ROCE of 11%. In absolute terms, that's a pretty standard return but compared to the Building industry average it falls behind.
View our latest analysis for Trellidor Holdings
While the past is not representative of the future, it can be helpful to know how a company has performed historically, which is why we have this chart above. If you're interested in investigating Trellidor Holdings' past further, check out this free graph of past earnings, revenue and cash flow.
What Does the ROCE Trend For Trellidor Holdings Tell Us?
The trend of returns that Trellidor Holdings is generating are raising some concerns. To be more specific, today's ROCE was 31% five years ago but has since fallen to 11%. In addition to that, Trellidor Holdings is now employing 30% less capital than it was five years ago. When you see both ROCE and capital employed diminishing, it can often be a sign of a mature and shrinking business that might be in structural decline. If these underlying trends continue, we wouldn't be too optimistic going forward.
On a side note, Trellidor Holdings' current liabilities have increased over the last five years to 52% of total assets, effectively distorting the ROCE to some degree. If current liabilities hadn't increased as much as they did, the ROCE could actually be even lower. What this means is that in reality, a rather large portion of the business is being funded by the likes of the company's suppliers or short-term creditors, which can bring some risks of its own.
The Key Takeaway
In summary, it's unfortunate that Trellidor Holdings is shrinking its capital base and also generating lower returns. Investors haven't taken kindly to these developments, since the stock has declined 40% from where it was five years ago. Unless there is a shift to a more positive trajectory in these metrics, we would look elsewhere.
Trellidor Holdings does come with some risks though, we found 4 warning signs in our investment analysis, and 3 of those are a bit unpleasant...
For those who like to invest in solid companies, check out this free list of companies with solid balance sheets and high returns on equity.
Have feedback on this article? Concerned about the content? Get in touch with us directly. Alternatively, email editorial-team (at) simplywallst.com.
This article by Simply Wall St is general in nature. We provide commentary based on historical data and analyst forecasts only using an unbiased methodology and our articles are not intended to be financial advice. It does not constitute a recommendation to buy or sell any stock, and does not take account of your objectives, or your financial situation. We aim to bring you long-term focused analysis driven by fundamental data. Note that our analysis may not factor in the latest price-sensitive company announcements or qualitative material. Simply Wall St has no position in any stocks mentioned.
