
 Yahoo Finance
 The Trend Of High Returns At Metals Exploration (LON:MTL) Has Us Very Interested
Did you know there are some financial metrics that can provide clues of a potential multi-bagger? In a perfect world, we'd like to see a company investing more capital into its business and ideally the returns earned from that capital are also increasing. Ultimately, this demonstrates that it's a business that is reinvesting profits at increasing rates of return. With that in mind, the ROCE of Metals Exploration (LON:MTL) looks great, so lets see what the trend can tell us.
Return On Capital Employed (ROCE): What Is It?
For those who don't know, ROCE is a measure of a company's yearly pre-tax profit (its return), relative to the capital employed in the business. Analysts use this formula to calculate it for Metals Exploration:
Return on Capital Employed = Earnings Before Interest and Tax (EBIT) ÷ (Total Assets - Current Liabilities)
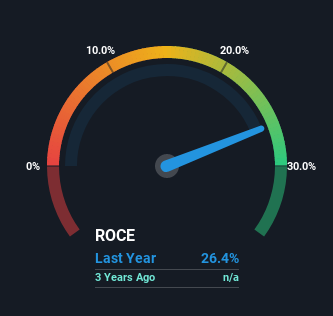
0.26 = US$24m ÷ (US$124m - US$32m) (Based on the trailing twelve months to June 2022).
So, Metals Exploration has an ROCE of 26%. That's a fantastic return and not only that, it outpaces the average of 11% earned by companies in a similar industry.
View our latest analysis for Metals Exploration
While the past is not representative of the future, it can be helpful to know how a company has performed historically, which is why we have this chart above. If you'd like to look at how Metals Exploration has performed in the past in other metrics, you can view this free graph of past earnings, revenue and cash flow.
What The Trend Of ROCE Can Tell Us
We're delighted to see that Metals Exploration is reaping rewards from its investments and has now broken into profitability. The company was generating losses five years ago, but now it's turned around, earning 26% which is no doubt a relief for some early shareholders. At first glance, it seems the business is getting more proficient at generating returns, because over the same period, the amount of capital employed has reduced by 54%. Metals Exploration could be selling under-performing assets since the ROCE is improving.
In Conclusion...
In summary, it's great to see that Metals Exploration has been able to turn things around and earn higher returns on lower amounts of capital. Astute investors may have an opportunity here because the stock has declined 64% in the last five years. With that in mind, we believe the promising trends warrant this stock for further investigation.
Metals Exploration does have some risks, we noticed 3 warning signs (and 1 which shouldn't be ignored) we think you should know about.
If you'd like to see other companies earning high returns, check out our free list of companies earning high returns with solid balance sheets here.
Have feedback on this article? Concerned about the content? Get in touch with us directly. Alternatively, email editorial-team (at) simplywallst.com.
This article by Simply Wall St is general in nature. We provide commentary based on historical data and analyst forecasts only using an unbiased methodology and our articles are not intended to be financial advice. It does not constitute a recommendation to buy or sell any stock, and does not take account of your objectives, or your financial situation. We aim to bring you long-term focused analysis driven by fundamental data. Note that our analysis may not factor in the latest price-sensitive company announcements or qualitative material. Simply Wall St has no position in any stocks mentioned.
Join A Paid User Research Session
You’ll receive a US$30 Amazon Gift card for 1 hour of your time while helping us build better investing tools for the individual investors like yourself. Sign up here
