
 Yahoo Finance
 The Trend Of High Returns At SurgePays (NASDAQ:SURG) Has Us Very Interested
What trends should we look for it we want to identify stocks that can multiply in value over the long term? One common approach is to try and find a company with returns on capital employed (ROCE) that are increasing, in conjunction with a growing amount of capital employed. This shows us that it's a compounding machine, able to continually reinvest its earnings back into the business and generate higher returns. Speaking of which, we noticed some great changes in SurgePays' (NASDAQ:SURG) returns on capital, so let's have a look.
What Is Return On Capital Employed (ROCE)?
Just to clarify if you're unsure, ROCE is a metric for evaluating how much pre-tax income (in percentage terms) a company earns on the capital invested in its business. To calculate this metric for SurgePays, this is the formula:
Return on Capital Employed = Earnings Before Interest and Tax (EBIT) ÷ (Total Assets - Current Liabilities)
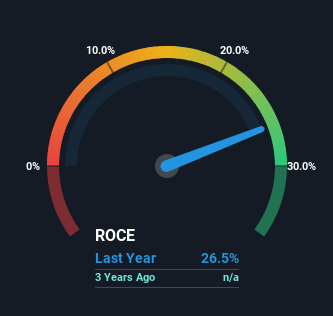
0.26 = US$16m ÷ (US$70m - US$9.4m) (Based on the trailing twelve months to March 2024).
So, SurgePays has an ROCE of 26%. That's a fantastic return and not only that, it outpaces the average of 14% earned by companies in a similar industry.
Check out our latest analysis for SurgePays
In the above chart we have measured SurgePays' prior ROCE against its prior performance, but the future is arguably more important. If you're interested, you can view the analysts predictions in our free analyst report for SurgePays .
What Does the ROCE Trend For SurgePays Tell Us?
We're delighted to see that SurgePays is reaping rewards from its investments and is now generating some pre-tax profits. Shareholders would no doubt be pleased with this because the business was loss-making four years ago but is is now generating 26% on its capital. Not only that, but the company is utilizing 8,360% more capital than before, but that's to be expected from a company trying to break into profitability. We like this trend, because it tells us the company has profitable reinvestment opportunities available to it, and if it continues going forward that can lead to a multi-bagger performance.
On a related note, the company's ratio of current liabilities to total assets has decreased to 14%, which basically reduces it's funding from the likes of short-term creditors or suppliers. This tells us that SurgePays has grown its returns without a reliance on increasing their current liabilities, which we're very happy with.
What We Can Learn From SurgePays' ROCE
To the delight of most shareholders, SurgePays has now broken into profitability. And since the stock has dived 86% over the last five years, there may be other factors affecting the company's prospects. Still, it's worth doing some further research to see if the trends will continue into the future.
Since virtually every company faces some risks, it's worth knowing what they are, and we've spotted 5 warning signs for SurgePays (of which 2 are potentially serious!) that you should know about.
SurgePays is not the only stock earning high returns. If you'd like to see more, check out our free list of companies earning high returns on equity with solid fundamentals.
Have feedback on this article? Concerned about the content? Get in touch with us directly. Alternatively, email editorial-team (at) simplywallst.com.
This article by Simply Wall St is general in nature. We provide commentary based on historical data and analyst forecasts only using an unbiased methodology and our articles are not intended to be financial advice. It does not constitute a recommendation to buy or sell any stock, and does not take account of your objectives, or your financial situation. We aim to bring you long-term focused analysis driven by fundamental data. Note that our analysis may not factor in the latest price-sensitive company announcements or qualitative material. Simply Wall St has no position in any stocks mentioned.
