
 Yahoo Finance
 The Trends At Information Services Group (NASDAQ:III) That You Should Know About

What are the early trends we should look for to identify a stock that could multiply in value over the long term? Firstly, we'll want to see a proven return on capital employed (ROCE) that is increasing, and secondly, an expanding base of capital employed. If you see this, it typically means it's a company with a great business model and plenty of profitable reinvestment opportunities. However, after investigating Information Services Group (NASDAQ:III), we don't think it's current trends fit the mold of a multi-bagger.
Return On Capital Employed (ROCE): What is it?
Just to clarify if you're unsure, ROCE is a metric for evaluating how much pre-tax income (in percentage terms) a company earns on the capital invested in its business. To calculate this metric for Information Services Group, this is the formula:
Return on Capital Employed = Earnings Before Interest and Tax (EBIT) ÷ (Total Assets - Current Liabilities)
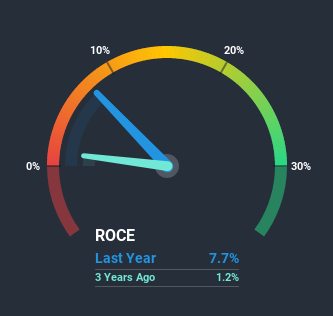
0.077 = US$14m ÷ (US$218m - US$41m) (Based on the trailing twelve months to June 2020).
Thus, Information Services Group has an ROCE of 7.7%. Ultimately, that's a low return and it under-performs the IT industry average of 10%.
See our latest analysis for Information Services Group
Above you can see how the current ROCE for Information Services Group compares to its prior returns on capital, but there's only so much you can tell from the past. If you'd like, you can check out the forecasts from the analysts covering Information Services Group here for free.
What The Trend Of ROCE Can Tell Us
On the surface, the trend of ROCE at Information Services Group doesn't inspire confidence. Over the last five years, returns on capital have decreased to 7.7% from 12% five years ago. However it looks like Information Services Group might be reinvesting for long term growth because while capital employed has increased, the company's sales haven't changed much in the last 12 months. It's worth keeping an eye on the company's earnings from here on to see if these investments do end up contributing to the bottom line.
The Bottom Line On Information Services Group's ROCE
Bringing it all together, while we're somewhat encouraged by Information Services Group's reinvestment in its own business, we're aware that returns are shrinking. And in the last five years, the stock has given away 47% so the market doesn't look too hopeful on these trends strengthening any time soon. Therefore based on the analysis done in this article, we don't think Information Services Group has the makings of a multi-bagger.
Information Services Group does come with some risks though, we found 2 warning signs in our investment analysis, and 1 of those is a bit unpleasant...
While Information Services Group may not currently earn the highest returns, we've compiled a list of companies that currently earn more than 25% return on equity. Check out this free list here.
This article by Simply Wall St is general in nature. It does not constitute a recommendation to buy or sell any stock, and does not take account of your objectives, or your financial situation. We aim to bring you long-term focused analysis driven by fundamental data. Note that our analysis may not factor in the latest price-sensitive company announcements or qualitative material. Simply Wall St has no position in any stocks mentioned.
Have feedback on this article? Concerned about the content? Get in touch with us directly. Alternatively, email editorial-team@simplywallst.com.
