
 Yahoo Finance
 Tribal Group (LON:TRB) Is Doing The Right Things To Multiply Its Share Price
To find a multi-bagger stock, what are the underlying trends we should look for in a business? Firstly, we'd want to identify a growing return on capital employed (ROCE) and then alongside that, an ever-increasing base of capital employed. If you see this, it typically means it's a company with a great business model and plenty of profitable reinvestment opportunities. So when we looked at Tribal Group (LON:TRB) and its trend of ROCE, we really liked what we saw.
Understanding Return On Capital Employed (ROCE)
For those that aren't sure what ROCE is, it measures the amount of pre-tax profits a company can generate from the capital employed in its business. Analysts use this formula to calculate it for Tribal Group:
Return on Capital Employed = Earnings Before Interest and Tax (EBIT) ÷ (Total Assets - Current Liabilities)
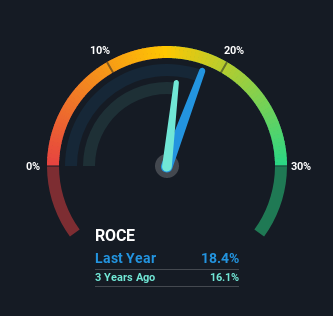
0.18 = UK£9.9m ÷ (UK£95m - UK£41m) (Based on the trailing twelve months to June 2021).
Therefore, Tribal Group has an ROCE of 18%. That's a pretty standard return and it's in line with the industry average of 18%.
Check out our latest analysis for Tribal Group
In the above chart we have measured Tribal Group's prior ROCE against its prior performance, but the future is arguably more important. If you'd like to see what analysts are forecasting going forward, you should check out our free report for Tribal Group.
So How Is Tribal Group's ROCE Trending?
Tribal Group has recently broken into profitability so their prior investments seem to be paying off. Shareholders would no doubt be pleased with this because the business was loss-making five years ago but is is now generating 18% on its capital. And unsurprisingly, like most companies trying to break into the black, Tribal Group is utilizing 70% more capital than it was five years ago. We like this trend, because it tells us the company has profitable reinvestment opportunities available to it, and if it continues going forward that can lead to a multi-bagger performance.
On a related note, the company's ratio of current liabilities to total assets has decreased to 43%, which basically reduces it's funding from the likes of short-term creditors or suppliers. So this improvement in ROCE has come from the business' underlying economics, which is great to see. Nevertheless, there are some potential risks the company is bearing with current liabilities that high, so just keep that in mind.
What We Can Learn From Tribal Group's ROCE
Long story short, we're delighted to see that Tribal Group's reinvestment activities have paid off and the company is now profitable. And investors seem to expect more of this going forward, since the stock has rewarded shareholders with a 80% return over the last five years. In light of that, we think it's worth looking further into this stock because if Tribal Group can keep these trends up, it could have a bright future ahead.
On a separate note, we've found 2 warning signs for Tribal Group you'll probably want to know about.
While Tribal Group may not currently earn the highest returns, we've compiled a list of companies that currently earn more than 25% return on equity. Check out this free list here.
Have feedback on this article? Concerned about the content? Get in touch with us directly. Alternatively, email editorial-team (at) simplywallst.com.
This article by Simply Wall St is general in nature. We provide commentary based on historical data and analyst forecasts only using an unbiased methodology and our articles are not intended to be financial advice. It does not constitute a recommendation to buy or sell any stock, and does not take account of your objectives, or your financial situation. We aim to bring you long-term focused analysis driven by fundamental data. Note that our analysis may not factor in the latest price-sensitive company announcements or qualitative material. Simply Wall St has no position in any stocks mentioned.
